Learn: Observability — orientation
How the platform sees itself — how a slow request, a crash loop, a memory leak, or a runaway LLM bill becomes something you can find and fix, and how little you had to do to make that possible. This is the platform’s senses: what it observes, how the signals get collected, where they live, how one stack safely holds every team’s data, how you walk between the signals to a root cause, and how they turn into a page at 3 a.m. — to the right person.
Observability is one of the largest subsystems here — around twenty modules standing up a full self-hosted telemetry stack — but almost all of it is platform-injected, so a developer gets the payoff without the plumbing. Understanding the machine is what makes you fast in an incident. It helps to have seen Foundations (the cluster this runs on) and Delivery (what “a deploy” is). Know roughly what a metric, a log, and a trace are, and we’ll build up the rest.
The question
Section titled “The question”It’s 3 a.m. alpha’s shop-web is slow. A user complained. You have a laptop and a login. What can you
actually find out — and what did the shop team have to do, ahead of time, to make it findable?
That second half is the surprising part. On most platforms the answer is “a lot”: the team had to pick a vendor, link a metrics library into their code, wire up a tracing SDK, ship logs somewhere, and hope they instrumented the right thing before the incident. Here the answer is almost nothing — and that’s the whole design. By the end of this page we’ll walk that 3 a.m. incident end to end — from a latency blip on a dashboard to the exact line of code — clicking, never re-typing a query into a different tool.
The one idea: the platform observes your workload for you
Section titled “The one idea: the platform observes your workload for you”Everything else is a consequence of this:
Observability here is a property of the platform, not a chore for the app. Your workload is watched from the moment it runs — four signals, collected mostly zero-code from below the process, stored together in one correlated stack on the platform’s own storage, isolated per team, and turned into SLOs, pages, and cost attribution. You write almost no telemetry config; the platform injects it, the way it injects your securityContext and your AWS credentials.
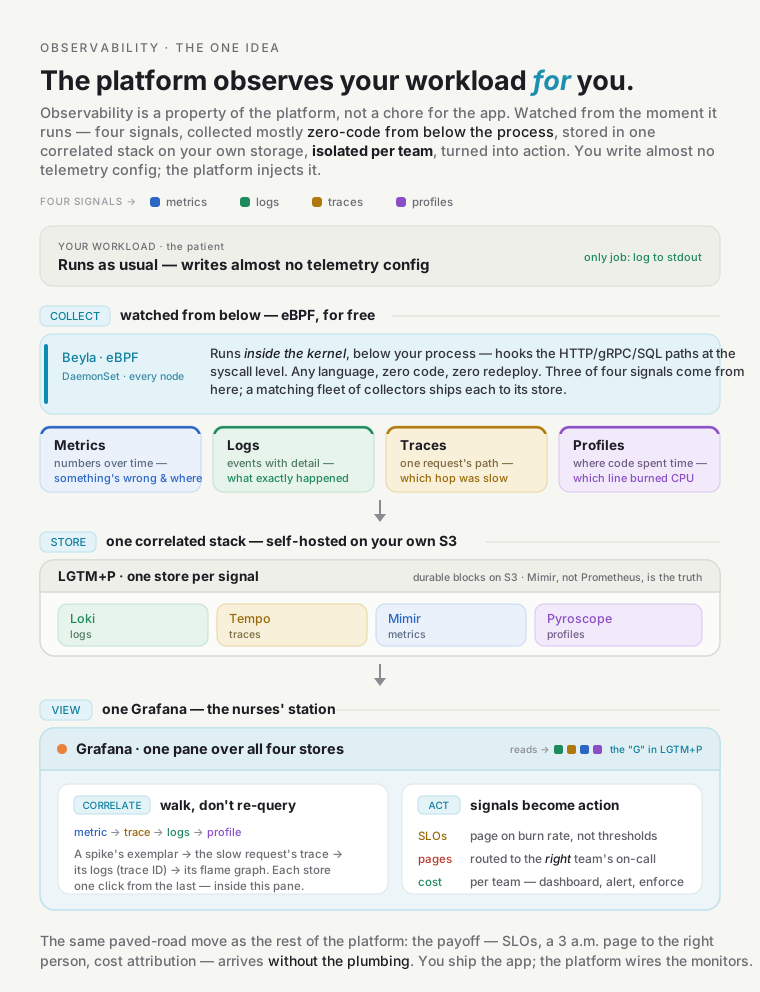
The metaphor for the whole doc is a hospital’s patient monitoring.
The moment a patient (your workload) is admitted, they’re wired to monitors — heart rate, oxygen, blood pressure, temperature (the four signals) — without the patient doing anything. Every monitor feeds one central nurses’ station (Grafana), where a clinician can glance from a vitals blip to the chart to the meds in one place (correlation). Alarms are tuned to page the right doctor, not the whole ward (SLOs + owner-routing). Each patient’s chart is private to their care team (per-team isolation). And the hospital owns its own monitors and records — it doesn’t rent them from a company that keeps the data. Where the metaphor breaks: hospital sensors are external clip-ons; the platform’s key sensor (eBPF, below) is wired into the kernel underneath your process, so it sees the inside of every request without touching your code. We’ll flag the seams.
The tour follows the data: the signals, how they’re collected, where they’re stored, how the stack keeps every team’s data separate, how you correlate across them, how you act on them, and finally how the platform even observes its own AI agents.
The four signals — and the stack that holds them
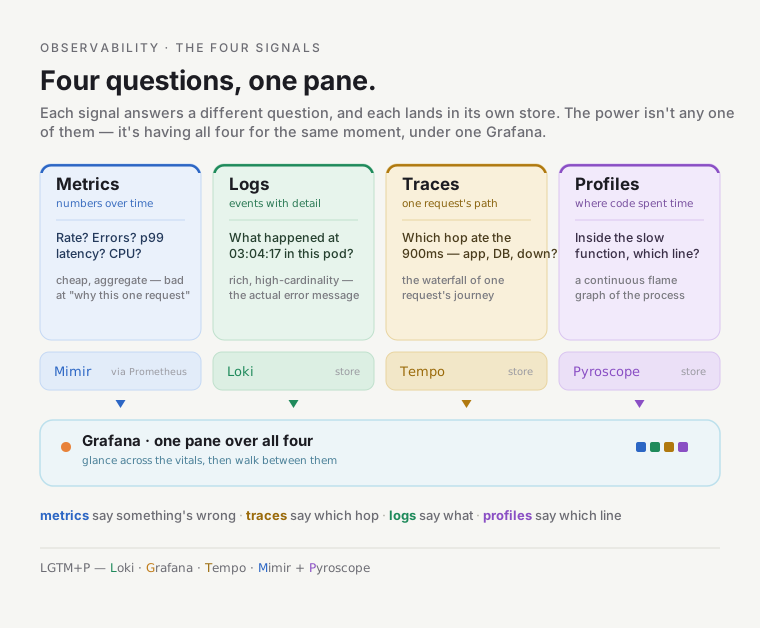
Section titled “The four signals — and the stack that holds them”Observability rests on four kinds of signal, and the trick to using them is knowing which question each one answers:
- Metrics — numbers over time. “What’s the request rate? The error ratio? CPU? The p99 latency?” Cheap, aggregate, great for dashboards and alerts. Bad at “why this one request.”
- Logs — events with detail. “What exactly happened at 03:04:17 in this pod?” Rich, high-cardinality, the place you read the actual error message.
- Traces — the path of one request across services. “Where did those 900ms go — the app, the database, the downstream call?” A trace is the waterfall of one request’s journey.
- Profiles — where the code spent its time. “Inside the slow function, which lines burned the CPU?” A continuous flame graph of the running process.
Metrics tell you something is wrong and roughly where; traces tell you which hop; logs tell you what; profiles tell you which line of code. The power isn’t any one of them — it’s having all four for the same moment and being able to walk between them (the correlation section). This platform runs the LGTM+P stack, one store per signal, all self-hosted: Loki (logs), Grafana (the view), Tempo (traces), Mimir (metrics), + Pyroscope (profiles).
Collection — watched from below, for free
Section titled “Collection — watched from below, for free”On most platforms, emitting these signals is the app’s job — link a library, wire an SDK, per language, and maintain it forever. Here it’s platform-injected: the platform stands up the collectors and instruments your workload without a line of app code, obeying the same paved-road rule as everything else.
The headline is Beyla — an eBPF agent running as a DaemonSet on every node. eBPF lets a program run inside the Linux kernel, and Beyla hooks the kernel’s networking and HTTP/gRPC/SQL paths. Watching request boundaries down at the syscall level, it auto-generates RED metrics (Rate, Errors, Duration), a service graph, and request-level traces — for every workload, in any language, existing or future, with zero code, zero manifest change, zero redeploy.
Beyla is a traffic camera on the highway, not a GPS unit you install in each car. It sees every vehicle’s speed and route from the outside — so a Go binary, a Python service, and a vendored appliance you can’t even recompile all light up identically, with nothing added. Where it breaks: a traffic camera sees the road, not the inside of the car — Beyla sees request boundaries, not your in-process function spans or custom attributes. That gap is exactly what the opt-in SDK layer fills.
That gives an instrumentation ladder you climb only as far as you need:
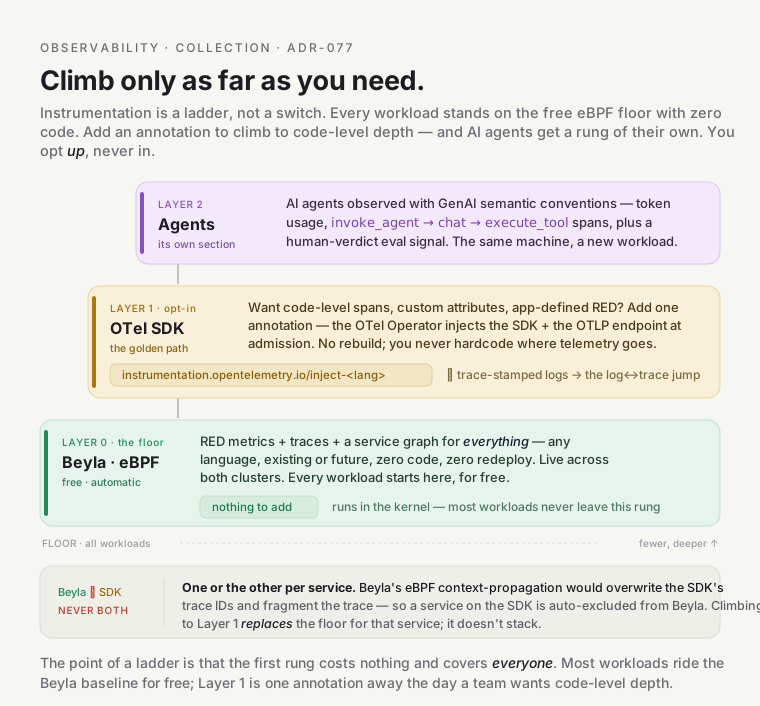
- Layer 0 — Beyla (eBPF), free and automatic. RED metrics + traces + service graph for everything, live across both clusters, no app change. This is the floor every workload stands on.
- Layer 1 — the OpenTelemetry SDK, the golden path. Want code-level spans,
custom attributes, and RED metrics your app defines? Add one annotation
(
instrumentation.opentelemetry.io/inject-<lang>) and the OTel Operator injects the SDK plus the platform’s OTLP endpoint at admission — no rebuild, and you never hardcode where telemetry goes. SDK-instrumented services additionally get trace-stamped structured logs, which unlocks the log↔trace jump below. (One rule: run the SDK or Beyla on a given service, never both — Beyla’s eBPF context-propagation would overwrite the SDK’s trace IDs and fragment traces.) - Layer 2 — agent observability, for AI agents (its own section near the end).
Around Beyla sits a fleet of purpose-built collectors — one per signal, each shipping its stream to the matching store (the collection deep dive names them all, plus the adjacent Cilium/Hubble network plane). The roster isn’t the point; the payoff is: your workload does nothing for three of the four signals — metrics, traces, and profiles come from eBPF — and for the fourth, logs, its only job is the oldest rule in the book: log to stdout.
Storage — self-hosted, on your own S3
Section titled “Storage — self-hosted, on your own S3”The signals land in the LGTM+P backends, and two design choices define the platform’s posture.
First, it’s self-hosted — the platform runs Grafana, Mimir, Loki, Tempo, and Pyroscope itself, on its own S3 buckets, rather than shipping everything to Datadog or Grafana Cloud. A SaaS observability bill is a metered utility — the meter spins on every host and every series, and at platform scale (many teams × many services × high cardinality) that meter becomes the dominant platform cost. Self-hosting is owning the generator: you pay compute you already run plus cheap S3, your data never leaves your account (residency), and dashboards and alerts are code in the repo (portability). The accepted trade is “we operate it” — which is the reference platform’s whole thesis: own your stack, and know how.
Second, the durable store is Mimir, not Prometheus. Prometheus stays the scraper with only ~15 days of
local history; it remote-writes every sample to Mimir, which keeps the long-range history on S3. So you can lose and rebuild Prometheus
without losing history — the truth is in Mimir/S3. Every store follows the same shape: a small hot buffer on
disk, the durable blocks on S3 (via Pod Identity, no static keys). A cluster-wide cost_profile gates the
expensive stores — dev runs Prometheus-only; the platform cluster flips the full LGTM+P bundle on
(single-replica), and prod scales it to HA (RF3, PDBs, ≥3 nodes).
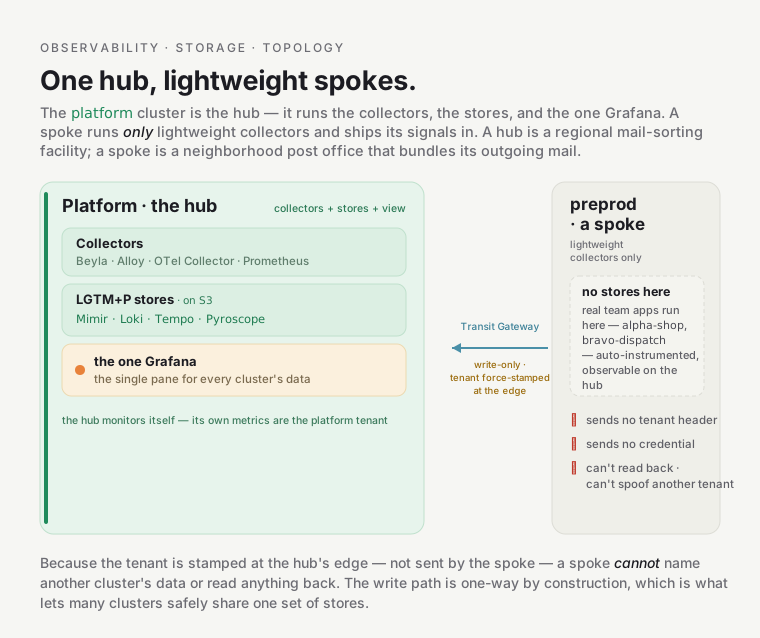
Topology: hub and spoke. The platform cluster is the hub — it runs the collectors and the
backends and the one Grafana. preprod is a spoke — it runs only lightweight collectors that ship their
signals to the hub over the Transit Gateway. The hub is a regional mail-sorting facility; a spoke is a
neighborhood post office that bundles its outgoing mail and ships it in. Crucially, a spoke reaches the hub’s
stores only through a write-only Gateway route that force-stamps the tenant at the edge — the spoke sends
no tenant header and no credential, and it cannot spoof another tenant or read anything back. The preprod
spoke is live for metrics, logs, and traces (plus profiles), and the real preprod apps
(alpha-shop, alpha-checkout, bravo-dispatch, …) are auto-instrumented and observable on the hub.
Tenancy — how one stack safely holds every team
Section titled “Tenancy — how one stack safely holds every team”One Grafana, one set of stores, many teams — so the interesting question is why can’t bravo read alpha’s
metrics? This is the most sophisticated part of the system, and it’s a layered answer, because the obvious
mechanism isn’t the real boundary.
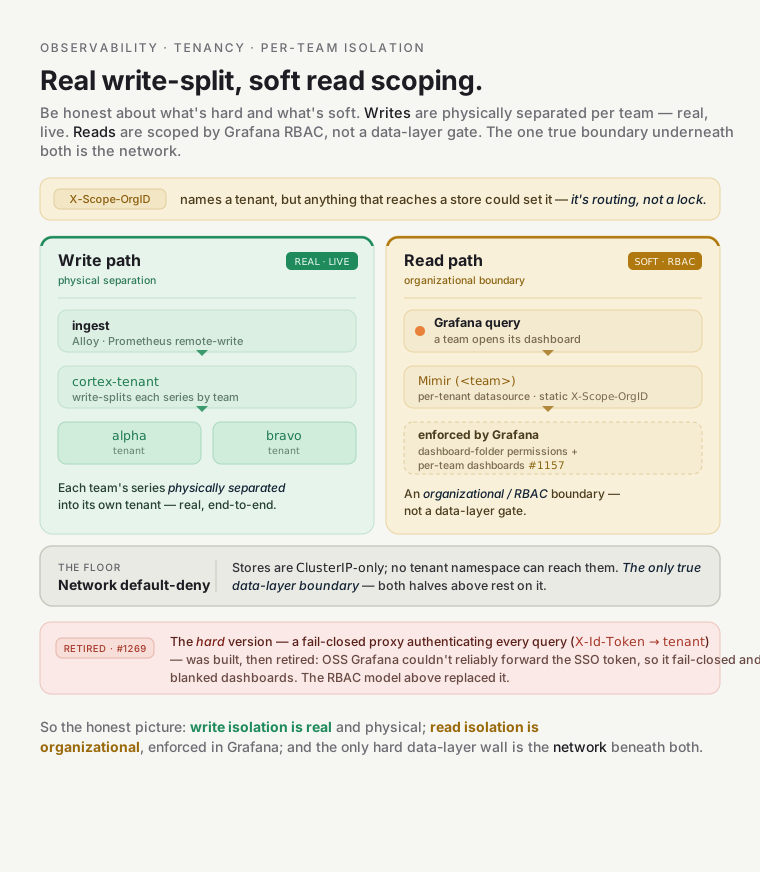
Every signal carries an X-Scope-OrgID header naming a tenant, and the stores run
multitenancy_enabled — they deliver to whatever tenant the header names. But hold onto the security fact:
X-Scope-OrgID is a trust header, not authentication. Anything that can reach a store and set the header
could name any tenant — like an apartment number written on an envelope. So the header is routing, not a
lock. Isolation is layered on top of it:
- The network is the floor. The
observabilitynamespace is default-deny ingress and every store is ClusterIP-only — never on the Gateway. No tenant workload can even reach Mimir or Loki to try naming a tenant. This is the boundary that actually holds; everything else is defense in depth above it. - Writes are split per team.
cortex-tenantre-tenants each incoming series into its own Mimir tenant (Loki does the same via per-team Alloy re-tenanting), soalphaandbravoare real, separate tenants end to end — not one bucket with a label. - Reads are scoped by Grafana, softly. Each team gets a datasource pinned to its own tenant
(
Mimir (<team>), a staticX-Scope-OrgID), and per-team read isolation is enforced by Grafana dashboard-folder permissions plus the namespace-filtered per-team dashboards — an RBAC-level boundary, not a data-layer gate. (Traces and profiles per-team read scoping is a follow-up.)
Be honest about that last bullet: read scoping is soft. It’s an organizational boundary — Grafana folder
permissions and per-team dashboards — not a fail-closed security gate. The header (X-Scope-OrgID) is
routing, not auth, so the thing that actually keeps a team from reading another’s data is the network floor
above: the stores are unreachable from any tenant namespace. (One subtlety regardless: the platform hub runs
no team workloads, so its own metrics are the platform tenant — the real per-team tenants come from the
preprod spoke’s live dual-write, where the team apps actually run.)
It’s a shared apartment building with a locked mailroom. The
X-Scope-OrgIDon each envelope is just the unit number — anyone could write one. What keeps your mail yours is that the mailroom door is locked (network default-deny), the boxes are physically separate (per-team tenants), and your key opens only your own box (Grafana folder permissions). Where it breaks: that last lock is a soft one — building policy, not a bank vault — so the real boundary is the locked mailroom door, not the box key. Cross-cluster ingest likewise rests on network isolation rather than mTLS today.
Correlation — the 3 a.m. walk, paid off
Section titled “Correlation — the 3 a.m. walk, paid off”This is the reason to run four stores under one Grafana instead of four vendor tools: you can walk from a symptom to its root cause without leaving the pane or re-typing a query. Here’s the 3 a.m. incident from the top, walked all the way down — every arrow below is a click wired into the Grafana datasources, not a copy-paste:
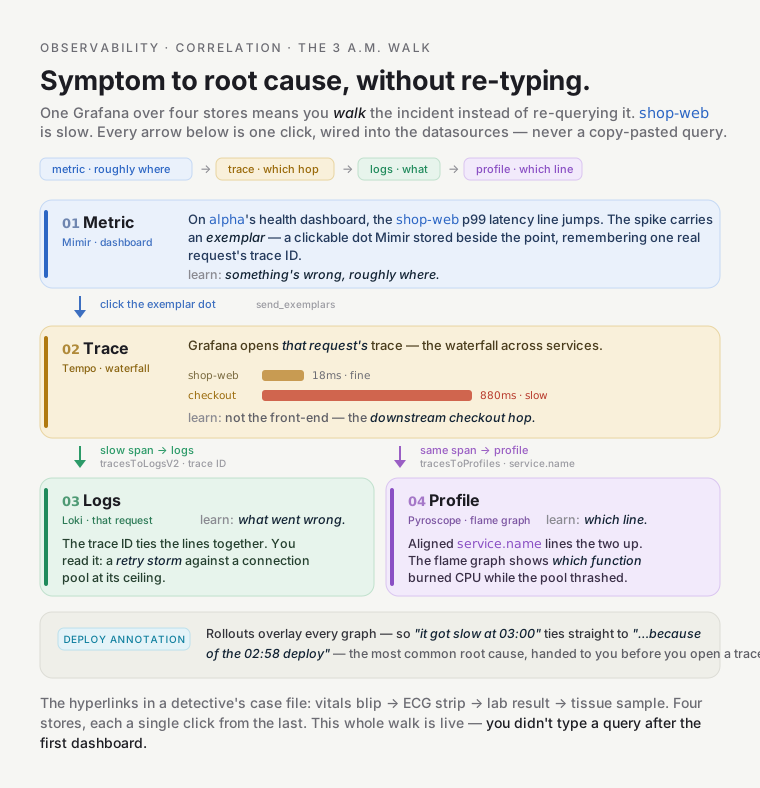
- Metric → trace. On
alpha’s workload-health dashboard, theshop-webp99 latency line jumps. The spike isn’t just a number — it carries an exemplar, a clickable dot that Mimir stored alongside the span-metric (Tempo’s metrics-generator setssend_exemplars, so each RED point remembers a representative request’straceID). You click the dot. - The trace waterfall. Grafana opens that request’s trace in Tempo — the waterfall of its journey across
services. The bars show where the time went: a sliver in
shop-web, then a long bar on the call tocheckout. So it isn’t the front-end — it’s the downstream hop. Which hop is now obvious; what went wrong there isn’t yet. - Span → logs. From the slow
checkoutspan you jump to that request’s logs in Loki — the trace ID ties them together (tracesToLogsV2one way; for SDK-instrumented services the log line’s owntrace_idfield jumps straight back, no regex). You read the line — say, a retry storm against a connection pool at its ceiling. Now you know what. - Span → profile. And from the same span you jump to the CPU flame graph in Pyroscope
(
tracesToProfiles) — because the eBPF profiler labels each process with the sameservice.nameBeyla stamps on traces, the two line up. The flame graph shows which function burned the CPU while the pool thrashed. Now you know which line.
It’s the hyperlinks in a detective’s case file. Each clue links to the next — the vitals blip → the ECG strip → the lab result → the tissue sample — four stores, each a single click from the last. That whole walk — RED spike → exemplar trace → its logs → its flame graph — is live today; you didn’t type a query after the first dashboard.
One more thing makes the walk land: deploy annotations overlay the graphs, so “it got slow at 03:00” ties straight to “…because of the 02:58 deploy” — the single most common root cause, handed to you before you’ve opened a trace.
Acting on signals — SLOs, pages, and cost
Section titled “Acting on signals — SLOs, pages, and cost”Collecting signals is worthless if nothing acts on them. Three ways they turn into action, each with its own deep dive.
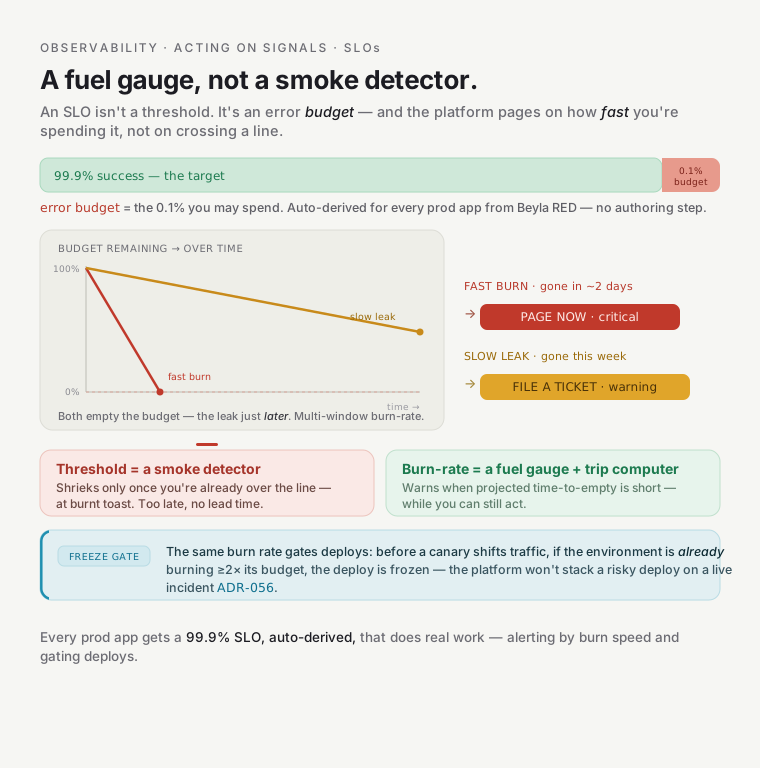
SLOs — judging “good enough” by burn rate. An SLO is a target (say 99.9% success) with an error budget
(the 0.1% you may spend). The platform alerts not on a raw threshold but on how fast you’re spending the
budget: a fast burn (budget gone in ~2 days) pages someone now; a slow leak files a ticket for the week.
A threshold alert is a smoke detector that shrieks at burnt toast; burn-rate is a fuel gauge with a
trip-computer — it warns when your projected time-to-empty is short. The sharp part: every prod app gets a
99.9%-success SLO auto-derived from its Beyla RED metrics — no authoring step — and it does real work.
Before any canary shifts traffic, a freeze gate checks the environment isn’t already burning through its
budget, so the platform won’t stack a risky deploy on top of a live incident. (Platform services get
hand-authored SLOs too; the deep dive has both mechanisms.)
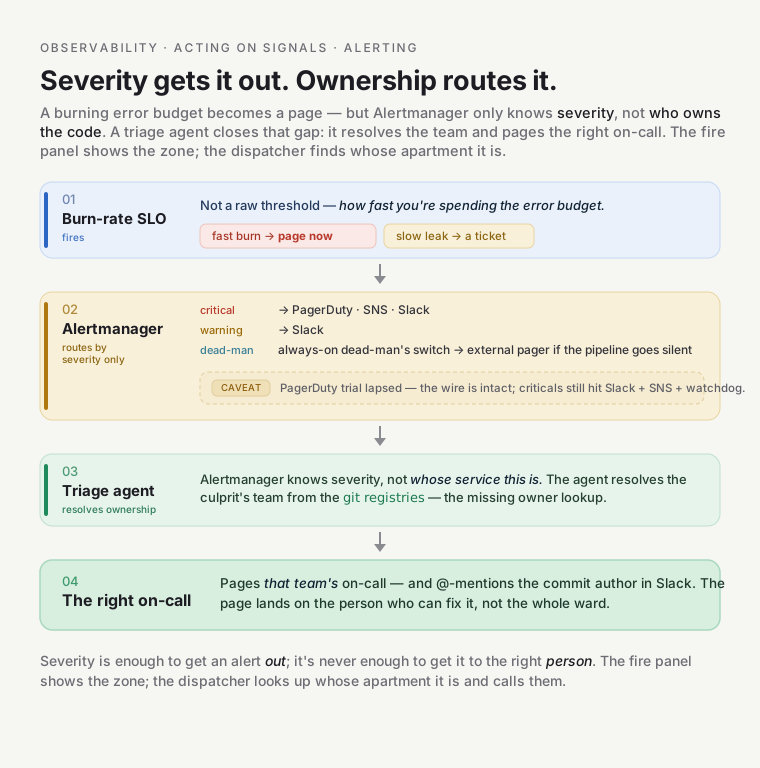
Alerts that page the right person. A curated alert set fires through
Alertmanager, routed by severity: critical → SNS + Slack + PagerDuty; warning → Slack; and an
always-firing dead-man’s switch pages an external service if the whole pipeline ever goes silent.
(Honest status: the critical→PagerDuty wire is real — an Events-API-v2 receiver fed by the pagerduty
unit’s routing key — but the PagerDuty trial account lapsed (~2026-07-07), so paging is momentarily offline;
criticals today still reach Slack + SNS + the dead-man’s switch, just not a human page. The design stands; the
account doesn’t.) But Alertmanager only knows severity, not ownership — so the triage agent
resolves the culprit’s team
from the git registries and routes the alert to that team’s on-call, @-mentioning the commit author in
Slack. The fire panel shows the zone; the dispatcher looks up whose apartment it is and calls them.
Cost as an observable signal. Cost is just another signal here — attributed per team in near-real-time and reconciled against the actual AWS bill, so it’s a metric you can dashboard, alert on, and even enforce: an over-budget team can be blocked from provisioning. (The live estimate vs the real billed spend — and why you want both — is in the deep dive.) It’s exactly how the “runaway LLM bill” from the opening becomes findable.
Observing the observers — agent observability
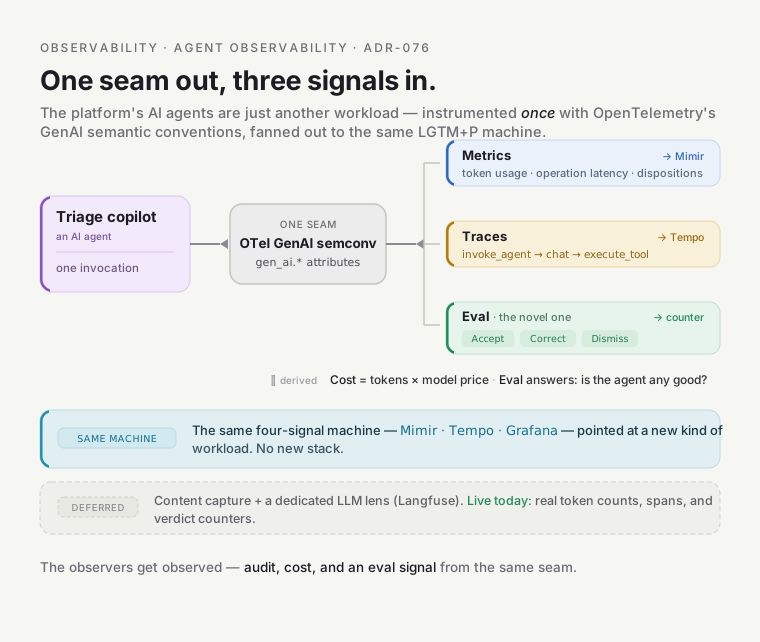
Section titled “Observing the observers — agent observability”The platform runs AI agents now (the triage copilot), and they get observed too — using OpenTelemetry’s
GenAI semantic conventions. One
instrumentation seam in the agent fans out to three consumers: metrics (token usage, operation latency,
dispositions) into Mimir; traces (invoke_agent → chat → execute_tool spans, enriched with gen_ai.*
attributes) into Tempo; and a durable eval signal — the human’s Accept/Correct/Dismiss verdict as a counter
— for measuring whether the agent is actually any good. Cost is derived (tokens × model price). This is live
— real token counts flow today; content-capture and a dedicated LLM lens (Langfuse) are deliberately deferred.
It’s the same four-signal machine, pointed at a new kind of workload.
The honest status — what’s live, and where the edges are
Section titled “The honest status — what’s live, and where the edges are”Almost all of it is live and exercised. The full LGTM+P data plane, the preprod spoke across all signals, real auto-instrumented apps, the correlation walk end to end, both SLO systems, alerting with owner-routing, cost (OpenCost + true-cost), and agent observability are all running. The edges worth knowing:
- Per-team isolation: write-split is real; reads are soft.
cortex-tenantsplits each team’s metrics/logs into its own real Mimir/Loki tenant (live). Read isolation is Grafana folder permissions + per-team dashboards — an organizational boundary, not a fail-closed security gate; the real data-plane boundary is the network floor. Traces/profiles per-team read scoping is a follow-up. - The OTel SDK golden path is real but not fleet-wide. The operator, the inject annotation, and the log↔trace correlation for SDK’d services are live; most workloads still ride the Beyla Layer-0 baseline, and rolling the SDK across the fleet is the ongoing golden-path work.
- PagerDuty paging is offline (trial account lapsed) — the wire is intact; only the account needs restoring.
- Cross-cluster ingest rests on network isolation, not mTLS — the tenant header is overwritten at the hub edge and spokes reach it only over the private VPC/TGW; mutual TLS between clusters is a planned hardening.
When it breaks — the ones you’ll actually hit
Section titled “When it breaks — the ones you’ll actually hit”- “My metrics/logs aren’t showing up.” Isolation is by network, not the
X-Scope-OrgIDheader — check your workload is in an instrumented namespace and the collector DaemonSet is healthy on its node; the stores are ClusterIP-only by design, so “I’ll just curl Mimir” won’t work from a tenant namespace (that’s the point). - “Grafana can reach the app but a probe/backend can’t.” The Cilium
ingressidentity (8) again — theobservabilitynamespace admits gateway traffic via aCiliumNetworkPolicyfromEntities: ["ingress"](see Foundations). - “I put the SDK annotation on but I’m getting no RED metrics.” For metrics specifically the app must create
and globally set a
MeterProvideralongside the tracer —otelhttpsilently emits no RED metrics without it (tracing alone doesn’t need it, which is why it’s easy to forget). Also: SDK metrics break out byjob(<team>-<product>/<svc>), notservice_name— group byjobin queries. - “The agent dashboard is empty.” Agent metrics are zero-recording instruments — they emit no series
until the agent’s first action / first human verdict. A cold agent shows only
target_info. Not broken — just quiet. - “Per-team data isolation — how strong is it?” Your writes land in a real separate tenant, but your reads are scoped softly — by Grafana folder permissions and your team-overview dashboard, not a fail-closed gate. Treat it as an organizational boundary, not a security wall (the real data-plane boundary is the network floor) — and use your team-overview dashboard as the ready-made view.
Go deeper
Section titled “Go deeper”The deep dives: the stack & storage, collection & instrumentation, correlation & the team experience, SLOs, alerting & cost, and agent observability. The lookup: the Reference.
The decisions behind it, if you want them: instrumentation strategy (ADR-077), the OTLP convention (ADR-100), self-hosting (ADR-043), and durable multi-tenant metrics (ADR-044).