Learn: Observability — the stack & storage (deep dive)
“Stored together in one correlated stack on the platform’s own storage” is a short promise hiding a lot: five separate databases, a bucket per signal, an SSO login, a tenancy model that’s really a network-security model in disguise, and a hub-and-spoke shape that lets a second cluster ship its telemetry home. This doc walks all of it. Per-team isolation is the subtlest claim in the domain, so it draws a sharp line between what carries data today (metrics + logs isolation, plus grant-based cross-team sharing) and what’s deferred (per-team traces + profiles isolation).
One shape does most of the work. Every signal is stored the same way: a purpose-built open-source database keeps a small hot buffer on a local disk and flushes the durable truth to its own S3 bucket, and all five are fronted by one Grafana. The database is disposable; S3 is the source of truth. That shape repeats five times with small variations, so once you understand one store you understand them all. Mimir (metrics) is the template; the others are variations on it.
The five backends, and what each one holds
Section titled “The five backends, and what each one holds”Here’s the whole pipeline on one screen — who collects each signal, which store keeps it, how one Grafana fronts them all, and how a spoke ships its telemetry home:
flowchart LR
  W["Workload pods"]
  W --> AL["Alloy<br/>tails logs"]
  W --> PR["Prometheus<br/>scrape + remote-write"]
  W --> BO["Beyla eBPF + OTel<br/>gateway"]
  W --> AE["Alloy eBPF<br/>profiler"]

  AL --> LK["Loki<br/>logs"]
  PR --> MI["Mimir<br/>metrics"]
  BO --> TE["Tempo<br/>traces"]
  AE --> PY["Pyroscope<br/>profiles"]

  LK --> GR["Grafana<br/>one query UI"]
  MI --> GR
  TE --> GR
  PY --> GR

  SP["Preprod spoke<br/>collectors"] -. "X-Scope-OrgID tenant<br/>network-isolated over TGW" .-> MI
  SP -. "X-Scope-OrgID tenant<br/>network-isolated over TGW" .-> LK
  SP -. "X-Scope-OrgID tenant<br/>network-isolated over TGW" .-> TE
The stack is LGTM+P, and each letter is a separate database, pinned to a specific chart version
in the repo’s single source of truth, infra/live/aws/_versions.hcl:
| Signal | Store | Helm chart (pin) | What it stores | Its S3 bucket |
|---|---|---|---|---|
| the view | Grafana | kube-prometheus-stack 87.5.0 |
nothing durable — dashboards/datasources as code | (its SQLite state is on a small PVC) |
| metrics | Mimir | mimir-distributed 6.0.6 |
TSDB blocks (compacted time-series) | …-mimir-blocks-… |
| logs | Loki | loki 7.0.0 |
log chunks + TSDB index | …-loki-chunks-… |
| traces | Tempo | tempo-distributed 2.25.5 |
trace blocks | …-tempo-traces-… |
| profiles | Pyroscope | pyroscope 2.1.0 |
profile blocks (flame-graph data) | …-pyroscope-profiles-… |
Grafana rides inside the kube-prometheus-stack bundle (which also brings Prometheus, Alertmanager,
node-exporter, kube-state-metrics). Mimir, Loki, Tempo, and Pyroscope are each their own Terragrunt unit and
their own module (observability-mimir, -loki, -tempo, -pyroscope). On the live hub they show up
exactly as you’d guess — the microservices fan out for Mimir and Tempo, single-binary for Loki and Pyroscope:
$ kubectl -n observability get pods # platform (hub), abridgedmimir-compactor-0 1/1 Runningmimir-distributor-… 1/1 Runningmimir-gateway-… 1/1 Runningmimir-ingester-0 1/1 Runningmimir-querier-… 1/1 Runningmimir-query-frontend-… 1/1 Runningmimir-query-scheduler-… 1/1 Runningmimir-store-gateway-0 1/1 Runningloki-0 2/2 Runningloki-gateway-… 1/1 Runningtempo-distributor-… 1/1 Runningtempo-ingester-0 1/1 Runningtempo-metrics-generator-… 1/1 Runningpyroscope-0 1/1 Runningkube-prometheus-stack-grafana-0 3/3 RunningIf mimir-ingester-0 crashes and its PVC is wiped, you lose a few minutes of metric history — only
the un-flushed working set. Everything already compacted to blocks is safe on S3. The store is
cattle; S3 is the herd.
Storage: a small gp3 hot buffer, a big cheap S3 tail
Section titled “Storage: a small gp3 hot buffer, a big cheap S3 tail”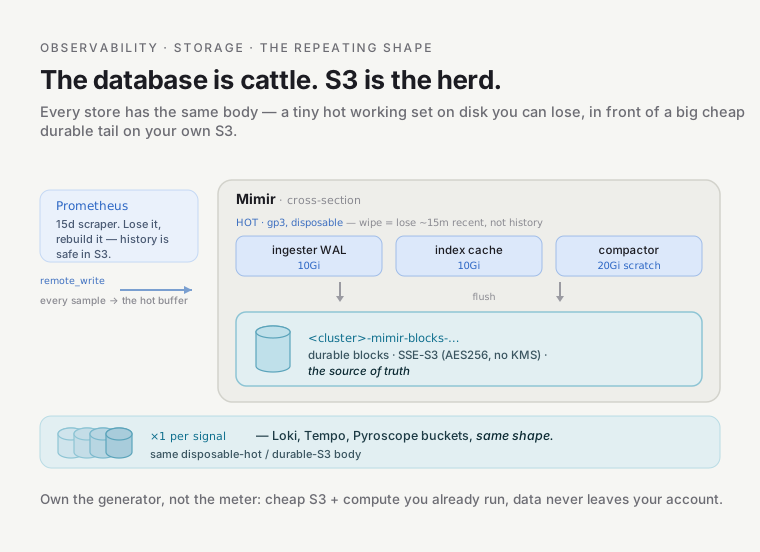
Take Mimir as the template. Its
observability-mimir module
gives the stateful components — ingester, store-gateway, compactor — a gp3 PersistentVolume each
(10Gi / 10Gi / 20Gi). That’s the working set: the ingester’s in-memory-plus-WAL window before a block is
cut, the store-gateway’s local cache of block indexes, the compactor’s scratch space. It’s deliberately
tiny, because it isn’t where the data lives.
The data lives in S3. Mimir’s blocks_storage points at a dedicated bucket (bucket_prefix = "<cluster>-mimir-blocks-"); Loki chunks, Tempo traces, and Pyroscope profiles each get their own
cluster-scoped bucket the same way. One bucket per signal, per cluster — so a blast radius, a lifecycle
policy, or an IAM scope is always about exactly one thing. Owning the generator, made concrete: the
durable tier is object storage you already pay pennies for, not a metered vendor.
SSE-S3, spelled out on every write — and why
Section titled “SSE-S3, spelled out on every write — and why”A gotcha that bites anyone who copies half of it. Every store’s S3 config carries an explicit
line — Mimir’s reads sse = { type = "SSE-S3" }, and Loki/Tempo/Pyroscope say the same. You might assume the
bucket’s default encryption (also set, AES256) makes this redundant. It doesn’t, and the reason is an org
Service Control Policy: enforce-encryption (DenyUnencryptedS3Uploads) rejects any PutObject whose
request omits the x-amz-server-side-encryption header. Default bucket encryption encrypts the object at
rest but doesn’t add that header to the request — so without the explicit client-side sse, every write
is denied by the SCP and the store silently fails to persist. Belt (default encryption) and suspenders
(explicit request header), because the SCP checks the suspenders.
SSE-S3 (AES256) over SSE-KMS is also deliberate: AES256 needs no per-object KMS call and, crucially,
no KMS IAM permission on the store’s role. An SSE-KMS bucket would force every store to carry
kms:GenerateDataKey*/Decrypt or its writes would AccessDenied — extra permission surface and
per-object cost on a high-churn store, for no benefit here.
The auth: Pod Identity, no IRSA, no keys
Section titled “The auth: Pod Identity, no IRSA, no keys”How does the ingester get credentials to write that bucket? EKS Pod Identity,
the platform’s standard AWS-identity mechanism. In the module the ServiceAccount is created with
annotations = {} — pointedly empty,
because the old IRSA way stamped an eks.amazonaws.com/role-arn annotation there. Instead an
aws_eks_pod_identity_association binds the tuple (namespace, service-account) → IAM role, and the role
trusts the service principal pods.eks.amazonaws.com (with sts:AssumeRole + sts:TagSession). The AWS SDK
inside the pod picks the credentials up from the container-credentials chain — no static keys, no OIDC
provider wiring, no annotation. The role’s policy is scoped to exactly that one bucket
(s3:GetObject/PutObject/DeleteObject on <bucket>/*, ListBucket on the bucket) and — because AES256 —
carries no KMS statement at all.
The metrics twist: Prometheus scrapes, Mimir keeps
Section titled “The metrics twist: Prometheus scrapes, Mimir keeps”Metrics have one extra move the other three signals don’t. Prometheus is still the scraper — it
pulls /metrics off every target — but it keeps only ~15 days of local TSDB (the module’s
prometheus_retention default) and remote_writes every sample to Mimir, which holds the long tail on
S3. So Grafana’s default datasource is Mimir, not Prometheus: the module provisions the Mimir datasource
with isDefault = true, and Prometheus stays selectable for recent/local queries. Lose Prometheus and you
lose nothing but the last few minutes of scrape buffer — the truth is in Mimir/S3.
Why Mimir and not Thanos? Both are OSS, object-store-backed, and mature — it’s defensible
either way. Tenancy decided it. Mimir’s multi-tenancy is native: a single X-Scope-OrgID header names
the tenant on both read and write, over one horizontally-scaled ingest path. Thanos bolts tenancy on via
a sidecar-per-Prometheus plus store-gateway federation — more moving parts to glue for a hub, and
multi-tenancy expressed through external labels rather than a native header. Since the whole point here is
centralized writes with a clean per-tenant spine (the spokes and, later, per-team), the native model won.
Amazon Managed Prometheus was rejected for the same reason as the SaaS options — per-sample ingest +
per-query billing, coarser IAM-shaped workspaces, AWS-only.
Mimir runs in its classic microservices architecture — distributor → ingester over gRPC — with
replication factor 1 on the reference cluster. That RF1 isn’t an accident to “fix”: with a single
ingester the RF must be 1 or writes are rejected. The chart’s newer default is a Kafka-based
ingest-storage path; the module turns that off (ingest_storage.enabled = false, kafka.enabled = false) to keep the reference cluster lean. One toggle, high_availability, flips the whole stack up to
RF3, zone-aware replication, and the memcached caches when a cluster warrants it — and it scales
replicas and RF together on purpose, because a lone ingester at RF3 rejects every write.
Grafana: the one remote for five TVs
Section titled “Grafana: the one remote for five TVs”Grafana is the central nurses’ station, and mechanically it’s a universal TV remote — one device,
and every store is a channel you flip to without learning five different remotes. That works because
datasources are code. Each store’s module emits a ConfigMap labelled grafana_datasource = 1; a
sidecar in the Grafana pod watches for that label and provisions the datasource live. No datasource is
ever clicked into existence in the UI.
The naming is deliberate, because it’s how tenancy surfaces to a human. Every datasource is named
"<Store> (<tenant>)":
Mimir (platform)— the hub’s own metrics (the default datasource,uid = mimir).Mimir (preprod)— a read-only view of the preprod spoke’s metrics.Mimir (all clusters)— a federated datasource whose header isplatform|preprod|alpha|bravo, so one panel spans every tenant (Mimir’stenant_federationsplits the|-joined header across tenants on read).Mimir (alpha)/Mimir (bravo)— a per-team datasource pinned to that tenant via a staticX-Scope-OrgID, direct to the gateway.
Loki, Tempo, and Pyroscope follow the identical (tenant) scheme. The datasources are wired to each
other for the correlation jump: the Mimir datasource carries exemplarTraceIdDestinations pointing
mimir → tempo (click a latency exemplar — a sampled data point on the histogram carrying one real
request’s trace_id — and land on the trace), and the Loki datasource carries a
derivedFields regex that turns a trace_id in a log line into a link to the same Tempo trace. (The
jumps themselves are the collection & correlation story; here just note that the plumbing
is datasource config, provisioned as code.)
Locked down, and SSO’d
Section titled “Locked down, and SSO’d”Grafana is the only part of this stack a human logs into, so it’s hardened in the
observability module:
anonymous access off, sign-up off, viewers_can_edit off, secure + strict-samesite cookies, CSP on. It’s
reachable Tailscale-only — an internal-scheme NLB behind the Cilium Gateway, never a public endpoint
(the same private-by-default posture as the EKS API).
Login is Keycloak OIDC (a generic_oauth block; the client secret is synced by External Secrets and
injected as an env var, never written into grafana.ini or state). Authorization is a one-line JMESPath over
the token’s groups claim:
contains(groups[*], 'platform-admins') && 'Admin' || 'Viewer'A member of platform-admins gets Grafana Admin; every other authenticated user gets Viewer. Note
the ceiling that sets: everyone-a-Viewer means everyone can see every dashboard and every cluster’s data.
That’s fine for a platform team, but it’s exactly why per-team read scoping matters — which brings us to
tenancy, and an honest story about how far the platform took it.
Tenancy: the apartment number is not a key
Section titled “Tenancy: the apartment number is not a key”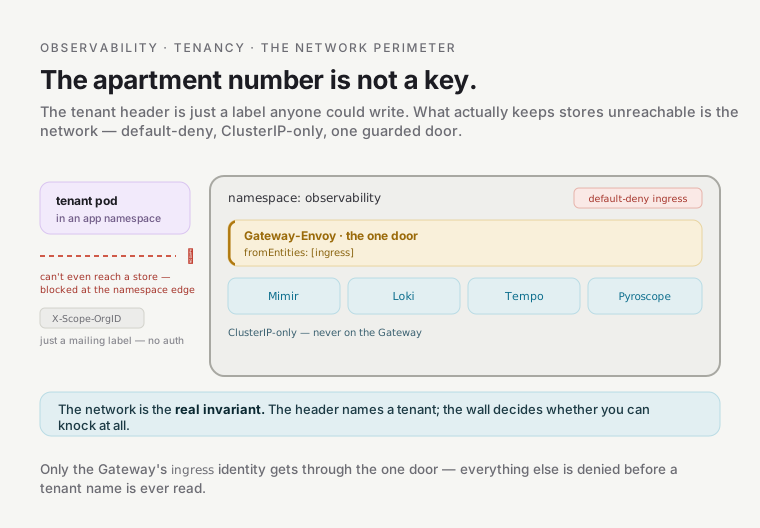
This is the subtle part, and the most important security fact in the stack. Every store has
multi-tenancy enabled (multitenancy_enabled on Mimir/Pyroscope, auth_enabled = true on Loki), and every
read and write carries an X-Scope-OrgID header naming a tenant. It’s tempting to read “auth_enabled”
and think the header authenticates the caller. It does not.
X-Scope-OrgID is a trust header, not authentication — the apartment number written on a piece of mail.
The store delivers to whatever apartment the envelope names; it never checks whether the sender was
allowed to write that number. Where the metaphor breaks: unlike a real building, there’s no doorman at
the store reading IDs. So if a tenant workload could reach Mimir, it could scribble any apartment
number and read or write any tenant’s data.
So the real isolation boundary is not the header — it’s the network, the single most important operational invariant in the stack. Two rules enforce it:
- The
observabilitynamespace is default-deny ingress. No pod outside it can open a connection in. - The stores are
ClusterIPonly — never on the Gateway. Verified live:mimir-gateway,loki-gateway,tempo-*,pyroscope, and the proxies all reportTYPE: ClusterIP. There’s no route from the internet, and no route from a tenant namespace, to a store.
The one thing allowed in is the Cilium Gateway’s Envoy — and even that needs a special rule, because
Envoy connects with Cilium’s reserved ingress identity (8), which a standard Kubernetes
NetworkPolicy from: clause can’t express. So the module admits it with a CiliumNetworkPolicy
(fromEntities: ["ingress"], e.g. allow-grafana-from-gateway) — the same Gateway-identity gotcha you’ll
meet all over this platform.
The cluster tenants are live and carrying data. Querying the hub’s Mimir gateway directly:
tenant=platform distinct_metric_names=4274tenant=preprod distinct_metric_names=1670platform is the hub’s own metrics; preprod is the spoke’s, shipped home — the next piece.
Hub and spoke: one door that stamps the tenant
Section titled “Hub and spoke: one door that stamps the tenant”The platform cluster is the hub — it runs both the collectors and all five backends. preprod is a
spoke: it runs lightweight collectors only, and ships its signals to the hub. The hub is a regional
mail-sorting facility; the spoke is a neighborhood post office that bundles its outgoing mail and trucks
it to the hub over the Transit Gateway (the private inter-VPC backbone).
The clever bit is the door the spoke ships through. For each spoke tenant, the Mimir module renders an HTTPRoute on the shared Cilium Gateway whose every rule force-stamps the tenant — so a spoke can only ever touch its own tenant, read or write:
- Force-sets
X-Scope-OrgIDto the mapped tenant with aRequestHeaderModifier, overwriting any value the client sent — on every rule of the route. - Always matches the push path (
/api/v1/push), and — only for tenants opted intoquery_tenants— the Mimir read path (/prometheus) too. On the live hub thepreprodspoke hasquery_tenants = ["preprod"], so it reads its own metrics back from the hub; because the header is force-set, that read still can’t reach any other tenant’s data.
That overwrite is the anti-spoof guard: since the edge stamps the tenant, a spoke physically cannot touch another tenant’s data — it can only ever land in its own. Authentication of the spoke itself is network isolation (the internal NLB is reachable only across the VPC/TGW); mTLS is a documented hardening follow-up, not yet in place.
Per-team isolation: hard write-split, soft reads
Section titled “Per-team isolation: hard write-split, soft reads”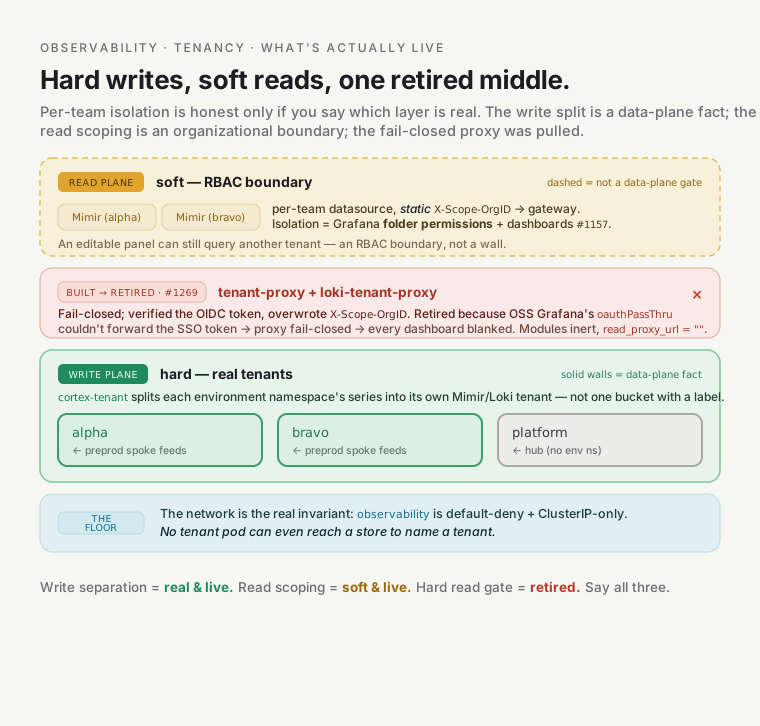
Per-team isolation is the place to be careful, so here’s the precise version — a trust artifact that over- or under-sells is worse than one with an honest gap.
Per-team write split — LIVE, with real data. Both environments set enable_per_team_tenants = true.
The mechanism is cortex-tenant (chart 0.8.1, running with 2 replicas on the hub): Prometheus/Alloy
remote-write through it instead of straight to Mimir, and a two-step relabel derives a route_tenant label
from the pod’s namespace — unconditionally platform first (so a pod can’t spoof it), then overridden to
the team for environment namespaces matching <team>-<product>-<stage>. cortex-tenant reads that label, sets
X-Scope-OrgID per-series, and strips the label so it’s never stored. The result is verifiable — the hub’s
Mimir has genuinely separate per-team tenants carrying data:
tenant=alpha distinct_metric_names=136tenant=bravo distinct_metric_names=118Those are real, isolated alpha and bravo tenants — the write split is running, not a diagram.
Per-team read scoping — soft. The write split gives you real separate tenants; read scoping is an
organizational boundary layered on top of them. Each team gets a datasource pinned to its own tenant
(Mimir (<team>) / Loki (<team>), a static X-Scope-OrgID), and per-team reads are fenced by Grafana
dashboard-folder permissions plus the namespace-filtered per-team overview dashboards. It’s an
RBAC-level boundary, not a fail-closed data gate — an organizational separation, not a security wall. The real
data-plane boundary underneath is the network (default-deny + ClusterIP-only stores). (The platform hub runs no
team workloads, so its own metrics are the platform tenant; the real per-team tenants come from the preprod
spoke’s dual-write, where the team apps run.) Per-team traces (Tempo) and profiles (Pyroscope) read
scoping is likewise a follow-up.
Cross-team sharing is a soft act too — share the dashboard or grant folder access.
Why self-host all of this at all?
Section titled “Why self-host all of this at all?”The whole doc is downstream of one choice: run the stack yourself instead of shipping everything to Datadog or Grafana Cloud. The trade is blunt — “we operate it.” Three reasons it’s worth that:
- Cost. A SaaS observability bill is a metered utility — the meter spins per host and per series, and at platform scale (many teams × many services × high cardinality) that meter becomes the dominant platform cost. Self-hosting is owning the generator: you pay compute you already run plus pennies of S3.
- Residency. The telemetry never leaves your AWS account — it sits in your own buckets under your own IAM.
- Portability. Dashboards, alerts, and datasources are code in the repo; the stack is OSS and moves across clouds. No vendor lock-in on the thing you stare at during every incident.
The modules keep a metrics_backend-style seam open, so if the ops burden ever outweighs the win on a given
cluster, switching to managed is a config change, not a rewrite.
Gotchas that teach
Section titled “Gotchas that teach”- Default bucket encryption is not enough — send
sseexplicitly. Theenforce-encryptionSCP checks the request header, which bucket defaults don’t add. Every store spells outsse = { type = "SSE-S3" }; omit it and writes silentlyAccessDeniedat the SCP. - SSE-S3 over SSE-KMS is a permissions decision. AES256 means the store’s IAM role needs zero KMS
actions. Switch a bucket to SSE-KMS and every store starts failing writes until you add
kms:GenerateDataKey*/Decrypt. - The empty ServiceAccount annotation is intentional.
annotations = {}is the tell that this is Pod Identity, not IRSA — the association binds(ns, SA) → roleout-of-band. Don’t “helpfully” add aneks.amazonaws.com/role-arnback; on an environment namespace Kyverno would reject it anyway. - RF must match replica count. RF1 with one ingester is correct; flipping
high_availabilityscales replicas and RF together. A lone ingester at RF3 rejects every write. X-Scope-OrgIDisolates nothing on its own. Isolation is the default-deny namespace + ClusterIP-only stores. A single over-broad NetworkPolicy or one store accidentally exposed on the Gateway would collapse the entire tenancy model — the network boundary is the invariant.- The Gateway needs a
CiliumNetworkPolicy, not a NetworkPolicy. Envoy’s reservedingressidentity (8) is invisible to a standardfrom:clause. Every store that admits Gateway traffic usesfromEntities: ["ingress"]. - Grafana Viewer-for-everyone is by design — per-team reads are fenced organizationally, not by a data gate. Grafana itself has no per-team RBAC (every authenticated non-admin is a Viewer). The per-team read boundary is Grafana dashboard-folder permissions plus the namespace-filtered per-team overview dashboards — an organizational separation, not a fail-closed data gate. The real data-plane boundary underneath is the network (default-deny + ClusterIP-only stores).
Go deeper
Section titled “Go deeper”- ADRs: ADR-043 (self-hosted stack), ADR-044 (Mimir + the tenancy invariant), ADR-047 (Pod Identity).
- Module code:
observability,observability-mimir,observability-cortex-tenant(-loki/-tempo/-pyroscopefollow the same shape). - Back to the map: the Observability orientation and the Reference.