Learn: Observability — correlation & the team experience (deep dive)
Two ideas share this file because they’re both the consuming side of observability — what an engineer does with the stack once the signals are flowing. First, correlation: the machinery that turns five stores into one investigation. Second, the per-team experience, where the subtle build-vs-live nuance lives.
Part 1 — correlation: the detective’s case-file hyperlinks
Section titled “Part 1 — correlation: the detective’s case-file hyperlinks”Correlation works like a detective’s case file where every clue hyperlinks to the next. The vitals blip links to the ECG strip, which links to the lab result, which links to the tissue sample — four stores, one click each, no re-typing a query into a different tool. That’s the whole payoff of running one Grafana over five backends instead of five vendor consoles.
Those hyperlinks aren’t a Grafana feature you turn on — they’re config you write into each
datasource. Grafana correlation is a set of directed links: on this datasource, a value shaped
like that opens this other datasource. Here’s the 4-click investigation, and the exact wiring
behind each click — four of the jumps we’ll walk; the module wires a couple more
(tracesToMetrics, the service graph) we’ll note in passing.
Click 1: a RED spike → the exact trace (metric → trace, via exemplars)
Section titled “Click 1: a RED spike → the exact trace (metric → trace, via exemplars)”You’re staring at a latency panel. A p99 spike. On most stacks that’s a dead end — the metric is an aggregate, it averaged away the one slow request you care about. The fix is an exemplar: alongside the aggregated histogram, the metric store keeps a handful of sample data points, each tagged with the trace ID of one real request that landed in that bucket. The spike carries clickable dots.
Two halves make this real. The producer is Tempo’s metrics-generator — it derives the RED
span-metrics from traces and stamps each exemplar with a traceID label. The consumer is the Mimir
datasource, told where that trace ID can be opened. From
observability-mimir/main.tf:
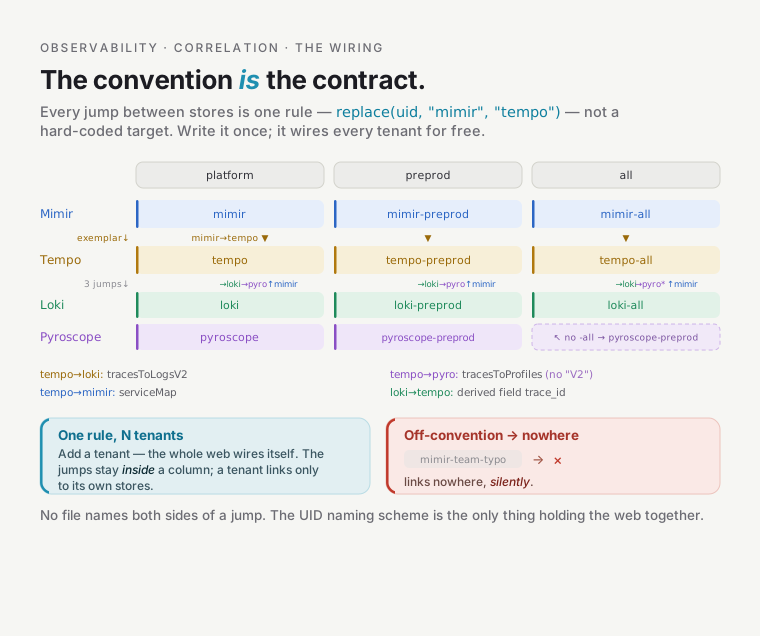
exemplarTraceIdDestinations = [{ name = "traceID" # the exemplar label the generator emits (camelCase) datasourceUid = replace(ds.uid, "mimir", "tempo")}]That replace(ds.uid, "mimir", "tempo") is what makes the correlation web scale to any number of
tenants. Datasource UIDs follow a convention — mimir, mimir-preprod, mimir-all — and every
jump is a string swap, not a hard-coded target. The platform tenant’s Mimir links to the platform
tenant’s Tempo (mimir→tempo); the preprod tenant’s Mimir links to preprod’s Tempo
(mimir-preprod→tempo-preprod); neither line of config names the other. The wiring is a rule, not a
table. (Exemplar storage is opt-in on Mimir — max_global_exemplars_per_user — because by default Mimir
keeps zero.)
Click 2: that trace → its logs (trace → logs, tracesToLogsV2)
Section titled “Click 2: that trace → its logs (trace → logs, tracesToLogsV2)”You clicked the dot; now you’re looking at a trace waterfall, and one span is fat. You want the log lines
that span emitted. The Tempo datasource carries a tracesToLogsV2 link, from
observability-tempo/main.tf:
tempo_traces_to_logs = { datasourceUid = var.loki_datasource_uid spanStartTimeShift = "-1h" spanEndTimeShift = "1h" filterByTraceID = true tags = [{ key = "service.name", value = "service_name" }]}Each field earns its place:
filterByTraceID = true— the Loki query it opens is scoped to this trace’s ID, not “all logs from that service.” You land on the exact request’s log lines.spanStartTimeShift/spanEndTimeShift = -1h / 1h— Grafana widens the log search window an hour each side of the span. Without the pad: a span timestamped by the app and a log line timestamped by the node’s clock never match to the millisecond, so a zero-width window would silently return nothing. The pad trades a little query cost for a link that actually resolves.tags— how a span attribute becomes a log label: the span’sservice.namemaps to Loki’sservice_name. The same name-alignment trick returns in Click 3.
Click 2b: and back again (logs → trace, Loki derived field)
Section titled “Click 2b: and back again (logs → trace, Loki derived field)”The case-file hyperlinks run both directions. If you started in the logs — grepping an error, no trace
in hand — a trace_id in the log line is itself clickable back to the trace. That’s a Loki derived
field. It used to be a regex that scraped raw log text; now it matches on Loki structured
metadata instead — first-class and robust, not a text scan. From
observability-loki/main.tf:
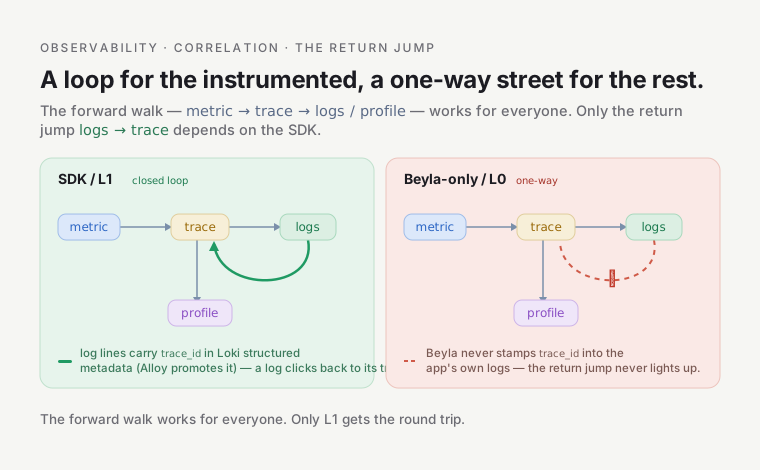
loki_derived_fields = [{ name = "trace_id" matcherType = "label" # matches structured metadata, not the log line's text matcherRegex = "trace_id" # the FIELD NAME now, not a pattern url = "$$${__value.raw}" # THREE `$`: Grafana blanks `${...}` during provisioning env-var substitution, so the sequence must be escaped datasourceUid = "tempo-all"}]Metric→trace→logs→trace is a loop for the workloads that opted into L1, a one-way street otherwise —
and that asymmetry is exactly what this jump adds. The trace_id value has to get into structured
metadata before this can match anything — that’s observability-alloy’s per-team pipeline, which promotes
trace_id/span_id out of the JSON log body into Loki structured metadata for SDK’d apps. So this jump
only resolves for SDK-instrumented services (alpha-shop, alpha-checkout — see
collection & instrumentation): Beyla doesn’t stamp a
trace_id into an app’s own log lines, so a Beyla-only workload has no field to promote and the derived
field never lights up for it — you still get metric→trace and trace→logs (tracesToLogsV2) for those,
just not the reverse jump.
Click 3: that span → its flame graph (trace → profile, tracesToProfiles)
Section titled “Click 3: that span → its flame graph (trace → profile, tracesToProfiles)”The span is slow inside the process — not waiting on a downstream call, just burning CPU. You want to know which function. The Tempo datasource links to Pyroscope:
# gated on var.enable_traces_to_profilestracesToProfiles = { # tempo→pyroscope, but Pyroscope has no `-all`: special-case `tempo-all` # → `pyroscope-<federated_profiles_cluster>` (the plain replace would point nowhere) datasourceUid = ds.uid == "tempo-all" ? "pyroscope-${var.federated_profiles_cluster}" : replace(ds.uid, "tempo", "pyroscope") profileTypeId = "process_cpu:cpu:nanoseconds:cpu:nanoseconds" tags = [{ key = "service.name", value = "service_name" }]}The field name is the gotcha that teaches: it’s tracesToProfiles, not tracesToProfilesV2 — unlike
logs (which really does have a tracesToLogsV2) there is no V2 variant for profiles, and Grafana silently
ignores the V2 name, so the “Related profiles” link just never renders. Same replace convention (tempo→pyroscope),
same service.name→service_name tag mapping. And here
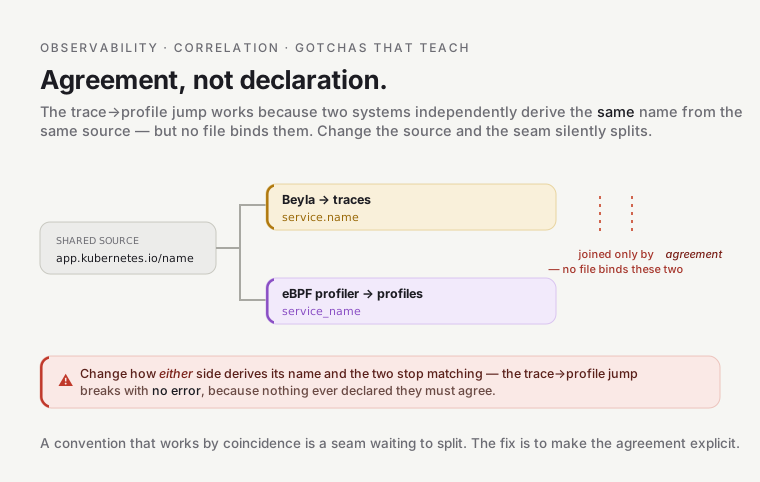
is the subtle thing that makes this jump possible at all: the trace and the profile have to agree on the
service’s name, and nobody set that name by hand. Beyla labels a trace’s service.name from the
workload’s app.kubernetes.io/name label (falling back to namespace); the eBPF profiler (an Alloy
pyroscope.ebpf DaemonSet) labels each profile’s service_name the same way. Two independent zero-code
agents, watching the same process from the kernel, arrive at the same identity — by deliberate convention,
not coincidence. Break that alignment (rename one label source) and the trace→flame-graph link silently
opens an empty profile. It’s the single most fragile seam in the correlation web, and the only one with no
config that names both sides — it’s an agreement.
Honest scope: this link resolves for any traced service that actually burns CPU. The platform’s trivial echo demo apps don’t burn enough to flame-graph under light load — so the jump is wired and correct, but you need a real workload (or load) to see a populated graph. Wiring live; interesting data is workload-dependent.
The overlays: service graph + deploy annotations
Section titled “The overlays: service graph + deploy annotations”Two more pieces aren’t “clicks” but frame the whole investigation.
The service graph answers “which hop” before you open a single trace. Tempo’s metrics-generator
also emits traces_service_graph_* metrics (request counts and latencies between services), and the
Tempo datasource’s serviceMap = { datasourceUid = replace(ds.uid, "tempo", "mimir") } tells Grafana to
render them as a node graph — storefront → alpha-checkout → …. Same swap convention, pointed back at Mimir
because the graph is metrics.
Deploy annotations answer “…and it got slow because of what?” The APM dashboard
(dashboards/platform-apm.json)
carries a dashboard-level annotation query:
"expr": "changes(kube_deployment_metadata_generation[2m]) > 0","name": "Deploys","tagKeys": "namespace,deployment"Every deploy draws a vertical line across the time series. So “latency spiked at 03:00” sits directly
under “…because of the 02:58 deploy of storefront” — the metric blip and its likely cause on one axis.
(kube_deployment_metadata_generation bumps on every spec change; changes() > 0 marks the moment.)
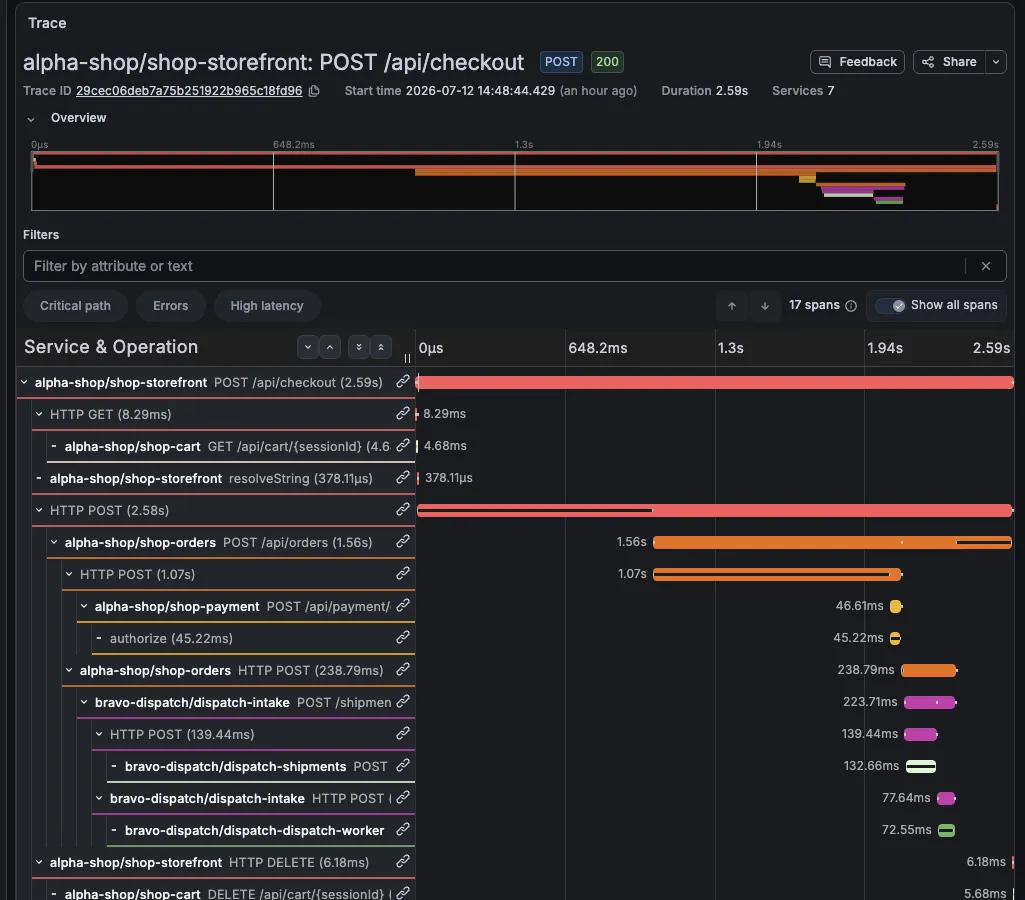
A real POST /api/checkout in Tempo (preprod), 2026-07-12 — 7 services, 2.59s, the exact structure the four clicks above walk. Watch it cross the team boundary: alpha-shop (storefront → cart → orders → payment) calls into bravo-dispatch (intake → shipments → dispatch-worker) at the ServiceGrant-governed hop — one trace spanning two teams.
Part 2 — the per-team experience
Section titled “Part 2 — the per-team experience”Correlation is what an engineer mid-incident does. The other consuming question is quieter and more political: when a team opens Grafana, what do they see, and can they see only their own stuff?
There are two separate efforts here — a default view and a real boundary — and conflating them is the mistake to avoid.
Effort 1 (the soft need, LIVE and actually used): per-team overview dashboards
Section titled “Effort 1 (the soft need, LIVE and actually used): per-team overview dashboards”What a team actually needs day-to-day isn’t a security boundary — it’s a default view: “show me my services’ health without me building a dashboard.” The platform delivers that the simple way, with one dashboard per team, auto-generated from the team registry.
The mechanism is deliberately unclever. There’s one template,
dashboards/team-overview.json.tmpl,
with a literal __TEAM__ placeholder everywhere a team name goes. The observability module renders it
once per team (observability/main.tf):
resource "kubernetes_config_map_v1" "team_dashboards" { for_each = local.create ? toset(var.team_overview_teams) : toset([]) metadata { name = "obs-dashboard-team-overview-${each.value}" labels = merge(local.k8s_labels, { grafana_dashboard = "1" }) annotations = { grafana_folder = "Teams" } } data = { "team-overview-${each.value}.json" = replace( file("${path.module}/dashboards/team-overview.json.tmpl"), "__TEAM__", each.value) }}And the team list is registry-derived — not a hand-maintained variable. The observability unit reads
it straight off the gitops/teams/ directory
(…/platform/observability/terragrunt.hcl):
team_overview_teams = [for f in fileset("${get_repo_root()}/gitops/teams", "*.yaml") : trimsuffix(basename(f), ".yaml")]Add a Team to the registry and they get an overview dashboard on the next apply. No dashboard authoring,
ever. Live today, one per registered team:
$ kubectl --context platform -n observability get cm | grep team-overviewobs-dashboard-team-overview-alpha 1 …obs-dashboard-team-overview-bravo 1 …obs-dashboard-team-overview-platform 1 …Those three match the three files in gitops/teams/ (alpha.yaml, bravo.yaml, platform.yaml) exactly
— the fileset in action.
What’s on the dashboard, and where the numbers come from — it’s a RED + USE view scoped to the team:
- Pre-filtered to the team. Each panel scopes to the team’s environment namespaces
(
<team>-<product>-<stage>, e.g.alpha-shop-dev) with a single regex — but on two labels, because the metrics come from different producers: the RED panels filterk8s_namespace_name=~"__TEAM__-.*"(the label the HTTP metric carries), the USE/cost panels filternamespace=~"__TEAM__-.*"(the label cAdvisor/kube-state carry). Same intent, two labels. - RED — request rate and 5xx ratio per environment off
http_server_request_duration_seconds_count, the same metric the SLOs use. It’s emitted by Beyla (zero-code) or an app’s OTel SDK; both converge on the same name andk8s_namespace_namelabel, so one query works regardless of delivery path. Exemplars ride the metrics-generator’s span-metrics, per Click 1. - USE, from cAdvisor/kube-state-metrics — CPU (
container_cpu_usage_seconds_total), memory (container_memory_working_set_bytes), running pods, restarts. - Cost, from OpenCost — an estimated
$/mopanel (container_cpu_allocation × node_cpu_hourly_cost, plus the memory equivalent, × 730h).
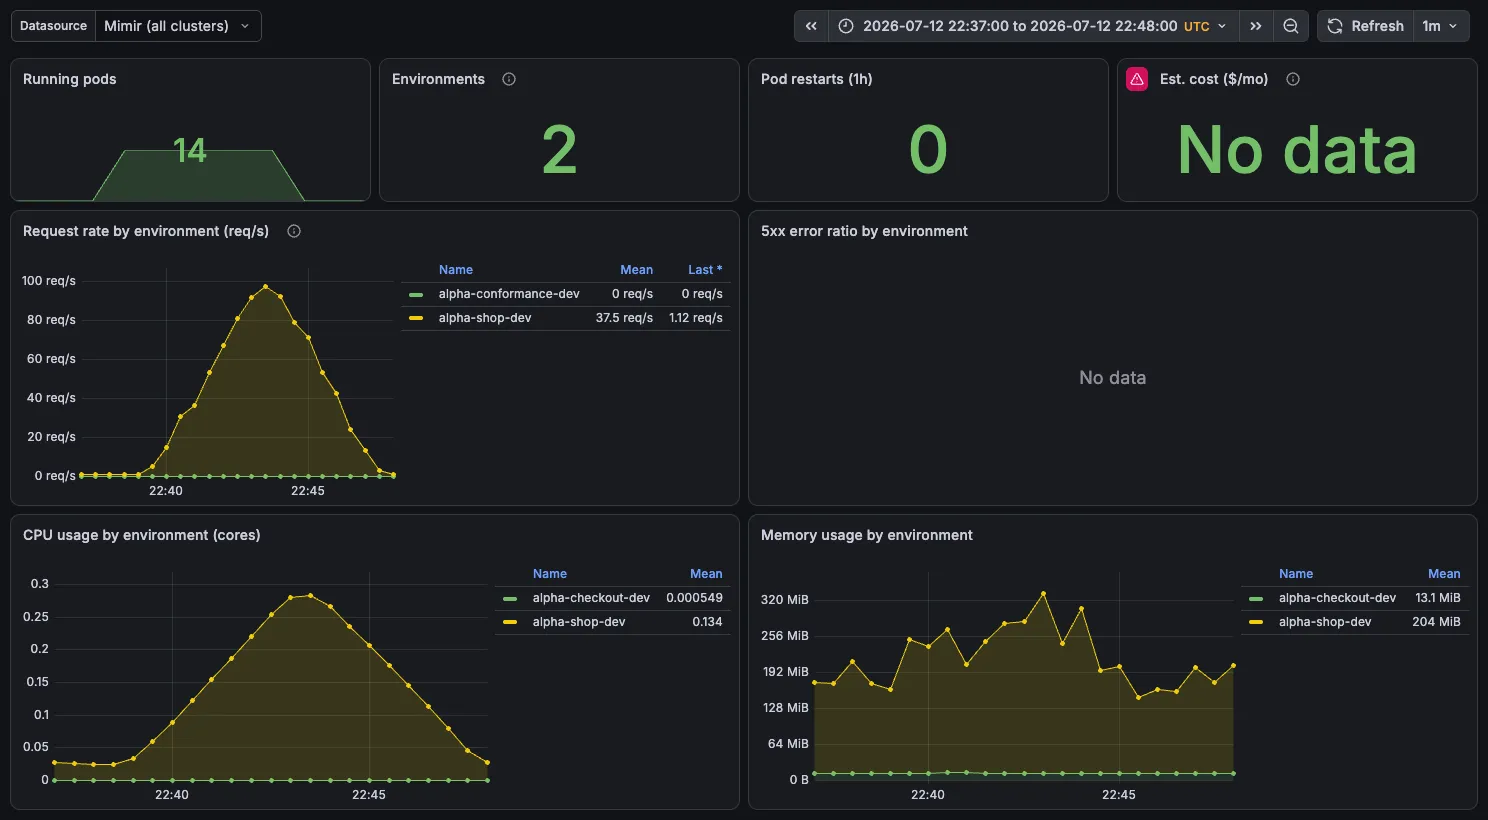
The real Team Overview — alpha dashboard during the 2026-07-12 load test: request rate per environment (alpha-shop-dev peaking ~100 req/s), the 5xx ratio (empty — the run had zero errors), and CPU/memory per environment. Note the two-label split in action — the RED panels filter k8s_namespace_name (the label the HTTP metric carries), the USE/cost panels filter namespace.
Crucially, it queries the federated Mimir (all clusters) datasource (uid mimir-all), not a
per-team-isolated one — the template’s default datasource is literally "Mimir (all clusters)".
This filter is a default view, not a boundary. The team regex (
k8s_namespace_name=~"alpha-.*"on the RED panels,namespace=~"alpha-.*"on USE) is baked into the panels, but nothing stops analphaengineer from editing the query tobravo-.*— the dashboard reads the all-clusters datasource, which can see every tenant. It’s the convenient lane, not a wall. That distinction is the whole point of Effort 2.
Effort 2 — the real per-team boundary: hard write-split, soft reads
Section titled “Effort 2 — the real per-team boundary: hard write-split, soft reads”The harder goal — making alpha’s data genuinely separate from bravo’s — has two layers, and they are
not equally hard. The write side is a real data-plane split; the read side is an organizational
boundary; and the fail-closed wall around a team’s data is the network.
Write isolation is real (live). A write-path router, cortex-tenant, sits in front of Mimir ingest: it
reads each series’ namespace label and stamps the matching per-team X-Scope-OrgID, so each environment
namespace’s series lands in its own Mimir tenant (Loki does the same for logs). alpha and bravo are real,
separate tenants — not one bucket with a label:
$ kubectl --context platform -n observability get pods | grep cortexcortex-tenant-… 1/1 Runningcortex-tenant-… 1/1 RunningThe genuinely per-team tenants (alpha, bravo, …) are populated by the preprod spoke’s dual-write —
preprod, where the team apps run, ships each namespace’s series into its own tenant (additive to preprod).
The hub carries no environment namespaces, so the hub’s own metrics stay the platform tenant (see the
footnote below). The separation of the data is real and live end-to-end.
Read scoping is soft (organizational). Each team reads through a Mimir (<team>) / Loki (<team>)
datasource pinned to its tenant, and per-team isolation on the read path is enforced by Grafana
dashboard-folder permissions plus the namespace-filtered per-team overview dashboards — an organizational
boundary, not a fail-closed data-plane gate. Cross-team sharing is soft the same way: share the dashboard
or grant folder access. The AccessGrant model (gitops/grants/) governs cross-team access in general.
Per-team traces/profiles read scoping is a follow-up.
The read scoping is not a security boundary. Folder permissions and per-tenant datasources shape what a team conveniently sees; they don’t fail closed the way an authenticated proxy would. The hard, fail-closed wall around a team’s data is the network — default-deny NetworkPolicy plus ClusterIP-only services — not the Grafana read path.
An architectural footnote worth keeping: the re-tenant splits metrics by environment namespace → team, and
the hub cluster has no environment namespaces (tenant workloads run on preprod, the spoke), so the
hub’s own metrics resolve to the platform tenant. The genuinely per-team alpha/bravo tenants are fed
from the preprod path. The platform
env.hcl records this
directly:
enable_per_team_tenants = true # …HUB flip first: hub metrics still resolve to the `platform`# tenant (no env namespaces here), proving the path before the spoke.So the per-team data separation is real where it matters: it flows through the preprod path, where the environment namespaces actually live.
Net for a team, today
Section titled “Net for a team, today”Open your Team Overview dashboard for a namespace-filtered RED/USE/cost view of your environments — the convenient default self-view, driven off the team registry. Underneath it, your writes land in a real, separate per-team tenant, while your reads are scoped by Grafana folder permissions and per-tenant datasources — an organizational boundary, not a fail-closed gate. That’s the current picture: real per-team data separation on the write path, soft per-team read scoping on top, with traces/profiles read scoping still deferred. The fail-closed wall around a team’s data is the network (default-deny + ClusterIP-only).
Dashboards-as-code — the substrate under both parts
Section titled “Dashboards-as-code — the substrate under both parts”Both the correlation dashboards and the team-overview dashboards ride the same delivery mechanism. Grafana
dashboards here are ConfigMaps,
not clicked-in-the-UI JSON: a kubernetes_config_map_v1 holding the dashboard JSON, labeled
grafana_dashboard = "1". A sidecar container in the Grafana pod watches for that label
in the observability namespace (searchNamespace = the module’s namespace) and loads any it finds within
seconds — so a dashboard ConfigMap must live in that namespace to be discovered, and a dashboard is a
reviewed, version-controlled file in infra/modules/observability/dashboards/, not tribal knowledge that
vanishes when someone edits it in the browser and forgets to export. (The team-overview ConfigMaps also set annotations = { grafana_folder = "Teams" }, which the sidecar reads to file them in Grafana’s Teams folder.)
Vendored dashboards are pinned to an exact grafana.com revision — downloaded and committed, never imported-by-ID live — so an upstream dashboard change goes through PR review like any other code, rather than silently reshaping your panels. Same discipline as pinning a chart version.
Gotchas that teach
Section titled “Gotchas that teach”- The correlation web is a naming convention, not a wiring diagram. Every jump is
replace(uid, "mimir", "tempo")-style string surgery over a UID naming scheme (mimir/mimir-preprod/mimir-all). Elegant — it scales to N tenants with zero per-target config — but it means a datasource named off-convention silently links nowhere. The convention is the contract. - The one link with no config on both sides is the fragile one. trace→profile works only because
Beyla’s
service.nameand the eBPF profiler’sservice_nameindependently derive fromapp.kubernetes.io/name. No file declares “these two must match.” Rename one label source and the jump opens an empty flame graph with no error. Agreements are harder to keep than declarations.
- Time-shifts on trace→logs aren’t sloppiness — they’re clock-skew insurance.
±1haround a span looks huge until you remember app-stamped span times and node-stamped log times never agree exactly; a zero-width window returns nothing and reads as “correlation is broken.” - “Namespace-filtered” ≠ “isolated”. The Team Overview filter is a baked-in default over the all-clusters datasource — convenience, not a boundary. The real separation is the write-split (each team’s data in its own tenant); read scoping on top is soft (Grafana dashboard-folder permissions + the per-tenant datasources), not a fail-closed gate. So don’t read the filter, or the soft read scoping, as a security control — the fail-closed wall is the network (default-deny + ClusterIP-only).
- A flag being
trueis a claim about intent, not effect.enable_per_team_tenantswas flipped hub-first — but the hub carries no environment namespaces, so its own metrics still resolve toplatform, and the genuinely per-team tenants are proven only where the data lands (the preprod spoke, now live and carrying data). Verify per-team data separation against where the data actually lands, not just the flag. - A team appears the instant it’s in the registry.
team_overview_teamsis afilesetovergitops/teams/*.yaml, so onboarding aTeamyields its overview dashboard on the next apply — and, conversely, a dashboard with no matching registry file can’t exist. Registry is the source of truth for the view, too.
Go deeper
Section titled “Go deeper”- Architecture:
docs/architecture/observability-current-state.md— APM-correlation, federated datasources, and the multi-tenancy model. - Related learn modules: The stack & storage (the
X-Scope-OrgIDtenancy model) · Collection & instrumentation (why Beyla and the eBPF profiler agree onservice.name) · SLOs, alerting & cost. - Code:
observability-mimir(exemplar destinations) ·observability-tempo(tracesToLogsV2/tracesToProfiles/serviceMap) ·observability-loki(thetrace_idderived field) ·team-overview.json.tmpl. - House skill:
observability-authoring— the dashboards-as-code ConfigMap pattern and vendored-revision pinning.