Learn: Observability — SLOs, alerting & cost (deep dive)
Collection and storage answer what happened? This one answers the harder question: is it bad enough to
wake someone, who, and is it costing too much? Three machines sit on top of the same Mimir metrics — an SLO
engine, an alert router, and a pair of cost exporters — and each is a small, opinionated decision about when
a number becomes a human action. Everything below is verified against the live platform cluster; the
reference is the terser lookup.
1. SLOs — judging “good enough” by how fast you’re bleeding
Section titled “1. SLOs — judging “good enough” by how fast you’re bleeding”An SLO (Service Level Objective) is three things bolted together:
- an SLI — a Service Level Indicator, the raw ratio you measure (here: non-5xx responses ÷ all responses);
- a target — the objective, e.g.
99.9; - an error budget — the arithmetic complement,
0.1%of requests you’re allowed to fail over the window. The budget is the whole point: it turns “be reliable” into a quantity you can spend, chart, and alert on.
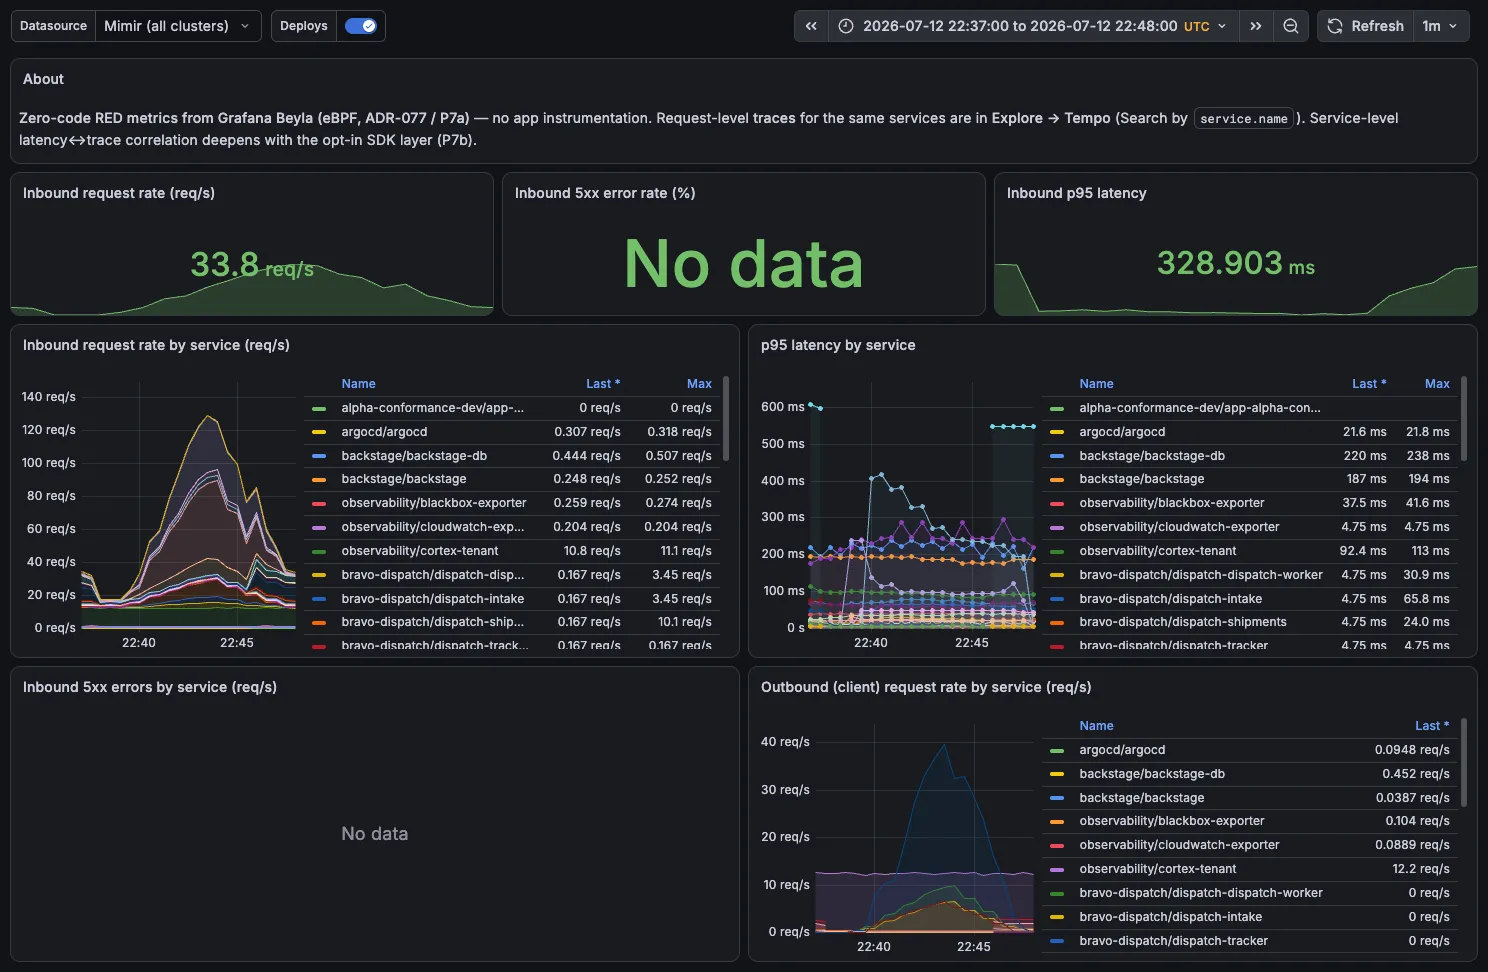
The raw RED those SLIs are computed from, live under a load test (2026-07-12): request rate, 5xx ratio, and p95 latency across every service by job — both teams side by side, alpha-shop/shop-* and bravo-dispatch/dispatch-* (33.8 req/s aggregate, p95 328ms, 0 errors).
Why burn-rate, not a threshold
Section titled “Why burn-rate, not a threshold”A threshold alert is a smoke detector that shrieks at burnt toast; a burn-rate alert is a fuel gauge with a
trip-computer. A naive alert fires when the error ratio crosses, say, 1% right now — so a 30-second blip
pages you, and a slow 0.2% leak that will blow your whole monthly budget by Friday never pages you. Burn
rate reframes it: how fast am I spending the budget relative to the window? A burn rate of 1 spends the
entire 30-day budget in exactly 30 days; a burn rate of 14.4 empties it in ~50 hours. To make that
concrete as an error rate a responder can eyeball: at a 99.9% objective the budget is 0.1%, so a 14.4× burn
is ≈ a 1.44% error rate sustained over the 5-minute window — that’s what trips the page.
What kills the false positives is multi-window, multi-burn-rate (the Google SRE workbook pattern): require a short window AND a long window to agree before firing. The short window makes it react fast; the long window makes sure it isn’t a transient spike. You can see both in the generated rule:
# fast burn (page): both windows must exceed 14.4× budget, or both exceed 6×(rate5m > 14.4*budget and rate1h > 14.4*budget)or (rate30m > 6*budget and rate6h > 6*budget)# slow burn (ticket): slower windows, lower multipliers(rate2h > 3*budget and rate1d > 3*budget)or (rate6h > 1*budget and rate3d > 1*budget)Fast burn → page (severity: critical); slow burn → ticket (severity: warning). Same SLO, two
alerts, wildly different urgency — that split is what lets one budget both page you at 3 a.m. and file a
Jira for a lazy leak, without a human tuning thresholds.
Two generators, one shape
Section titled “Two generators, one shape”The platform generates these rules two ways, and they live on different tenants.
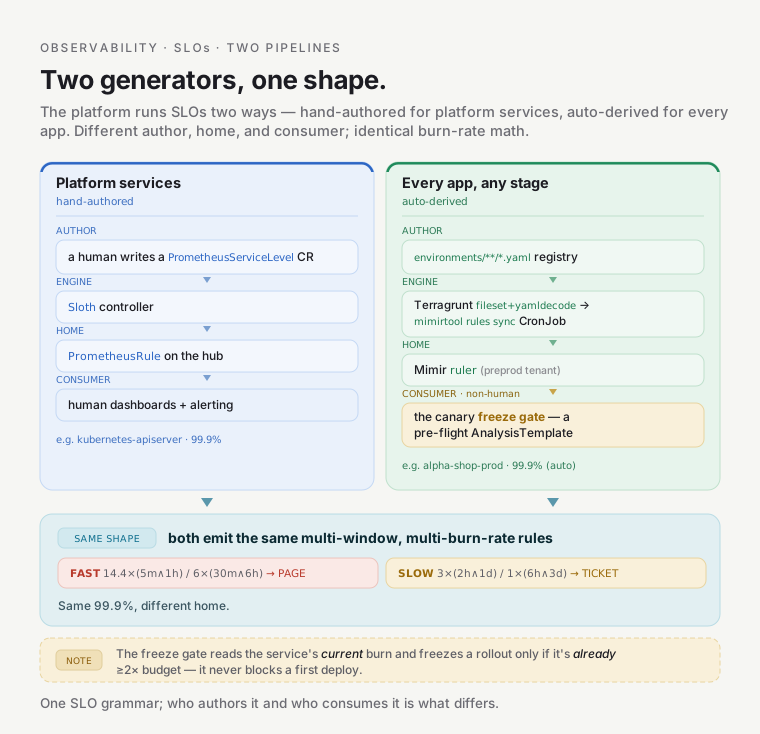
| Path A — Sloth (platform services) | Path B — auto-derived (every app, every stage) | |
|---|---|---|
| Who authors it | A human hand-writes a PrometheusServiceLevel CR (objective + two queries) |
No one — fileset+yamldecode over gitops/environments/**/*.yaml synthesizes it |
| Where it’s evaluated | The Sloth controller renders a PrometheusRule, evaluated on the hub |
A template → mimirtool rules sync CronJob → the Mimir ruler against the preprod tenant |
| Who consumes it | Human dashboards + alerting (live: kubernetes-apiserver @ 99.9%) | The canary freeze gate (fixed 99.9%; live: alpha-shop-prod) |
Path A — the Sloth controller, for platform SLOs. Sloth (chart 0.16.0) is a
controller that watches a PrometheusServiceLevel custom resource and generates the SLI recording rules +
the multi-window burn-rate PrometheusRule for you — you write the objective and the two queries, it writes
the ~30 lines of PromQL. The one live platform SLO is the Kubernetes API server at 99.9% (it’s the one
control-plane signal EKS exposes that always has traffic). Verified on the hub:
$ kubectl -n observability get prometheusservicelevelNAME                   SERVICE                DESIRED SLOS   READY SLOS   GEN OK   AGEkubernetes-apiserver   kubernetes-apiserver   1              1            true     14d
$ kubectl -n observability get prometheusrule kubernetes-apiserver \    -o jsonpath='{range .spec.groups[*]}{.name}{"\n"}{end}'sloth-slo-sli-recordings-kubernetes-apiserver-requests-availabilitysloth-slo-meta-recordings-kubernetes-apiserver-requests-availabilitysloth-slo-alerts-kubernetes-apiserver-requests-availability
One CR in, three rule groups out (recordings, metadata, alerts) — the controller did the burn-rate math.
Path B — the Mimir ruler, for per-app SLOs. Every environment, any stage, gets a 99.9%
HTTP-success SLO plus a 99% sub-500ms latency SLO — auto-derived, no one writes it. The mimir
Terragrunt unit filesets over gitops/environments/**/*.yaml, and for each claim it synthesizes an
SLO whose SLI is http_server_request_duration_seconds_count filtered to the app’s namespace
(k8s_namespace_name). The query doesn’t care whether that metric came from Beyla (native
Prometheus naming) or an app’s OTel SDK — Mimir’s OTLP ingest translates SDK metrics to the same
..._seconds naming and promotes k8s.namespace.name to the same label
(otel_metric_suffixes_enabled + promote_otel_resource_attributes), so one query works for both
delivery paths — a Beyla-only app and an SDK’d app (e.g. alpha-shop) get the identical SLO mechanism
for free. This is registries-as-source (the same pattern the whole platform runs on): add an
environment, get an SLO free.
Two things differ from Path A. First, these rules are rendered from a template into a Mimir ruler
namespace and evaluated in the Mimir ruler against the preprod tenant — because that’s where the app
metrics actually live (preprod is a spoke that remote-writes to the hub). Second, the consumer is not a human
at all: the rules emit slo:current_burn_rate:ratio per app, and that metric is what the progressive-delivery
canary freeze gate queries
— a one-shot pre-flight check (an AnalysisTemplate with count: 1) that runs before the rollout and
freezes it if the service is already burning its budget faster than 2× (successCondition
len(result) == 0 || result[0] < 2). It does not predict the canary’s own burn, and it can never block a
first deploy (with no prior series there’s nothing to be burning). The SLO stops being a dashboard and
becomes a deploy gate.
The same 99.9% objective comes from a controller in one case and a templated ruler rule in the other because
the data lives on different tenants: apiserver metrics are the hub’s own; app metrics belong to the preprod
tenant, which the Mimir ruler evaluates.
2. Alerting — ~60 curated rules and a routing tree
Section titled “2. Alerting — ~60 curated rules and a routing tree”Below the SLOs sits the everyday alert layer:
observability/alerts/curated.yaml
— 61 alerts across 20 groups (e.g. cert-manager, kyverno, policy-reporter, true-cost, argocd, loki,
tempo, external-secrets, cilium, cloudwatch, agent-eval, cloudnativepg, blackbox, karpenter, controllers,
keycloak, crossplane, mimir, tailscale, platform-services), one group per subsystem. Every rule
carries two things that make it actionable rather than just noisy: a severity label (which is what routes
it) and a runbook_url annotation (which is where the responder goes). A rule without a runbook is a rule
that pages you into a void.
Severity is a decision, and it can be wrong
Section titled “Severity is a decision, and it can be wrong”The severities aren’t cosmetic — they encode a judgement about blast radius, and that judgement is
revisable. The clearest lesson is baked into the ArgoCD and External-Secrets groups after a 6-day silent
delivery outage (2026-07-02): the repo-server lost read access to a repo, manifests silently stopped
generating, and nothing paged because the relevant alerts were warning. The fix upgraded three alerts to
critical and added one:
ArgoCDRepoServerGitErrors— warning → critical (an unreadable repo blinds the whole delivery plane).ArgoCDAppSyncUnknown— new critical (aComparisonErrorapp is neither Synced nor OutOfSync and can stay Healthy, so the existing alerts missed it entirely;for: 1hfilters normal transient Unknowns).ExternalSecretNotReady/ClusterSecretStoreNotReady— warning → critical (a stalled secret sync is a credential outage waiting for the next pod restart).
Severity is a claim about impact, and the audit gate applies to it like any other claim. “This is only a warning” is exactly the assumption that hid a six-day outage.
The routing tree
Section titled “The routing tree”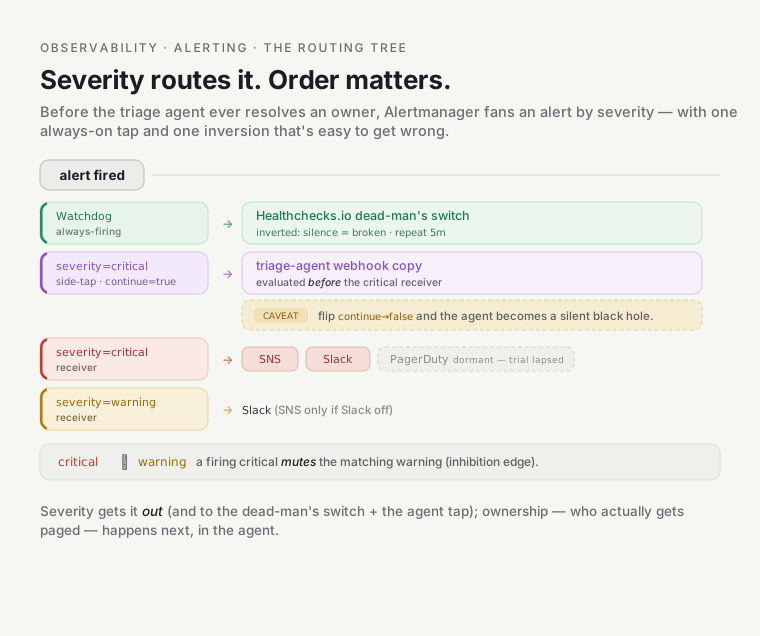
Alertmanager routes purely by the severity
label — it knows nothing about ownership (that’s §3). The tree, built in
observability/main.tf
and verified wired on the live hub:
Watchdog(an always-firing synthetic alert) → the dead-man’s switch: every ~5 minutes it POSTs to an external Healthchecks.io ping URL. If Prometheus or Alertmanager dies, the pings stop and Healthchecks pages you from outside the cluster — the one failure the in-cluster pipeline physically cannot alert on itself. Watchdog never reaches any other receiver (nocontinue).severity: critical→ thecriticalreceiver: SNS + Slack + PagerDuty all three. (Status caveat: the PagerDuty leg is a real Events-API-v2 wire, keyed by thepagerdutyunit’s routing key, and was live — but the PagerDuty trial account lapsed (~2026-07-07), so the page half is momentarily offline:criticaltoday lands on SNS + Slack + theWatchdogdead-man’s switch, not a human page. The routing design is unchanged — critical→PagerDuty is the intended path; treat the PagerDuty leg as wired-but-dormant until the account is restored.)severity: warning→ thewarningreceiver: Slack only (SNS is a fallback used only when Slack is disabled), but not PagerDuty — warnings notify, they don’t page.- Inhibition: a firing
criticalinhibits a matchingwarning(samenamespace+alertname) so one incident doesn’t double-notify. - The triage fan-out: a separate route matches
severity: criticalwithcontinue = trueand copies it to the triage agent’s webhook — additively. Thatcontinueis what keeps the alert flowing on to the critical receiver. The agent is a copy on the wire, not an interceptor.
That last route is the hinge into ownership. Flip its continue to false and the alert would stop at the
agent and never reach SNS/Slack/PagerDuty — the agent would silently swallow every critical page.
3. Owner-routing — from severity to a name
Section titled “3. Owner-routing — from severity to a name”Alertmanager routed by severity. But who owns the broken thing? That’s a different lookup, and mixing it into Alertmanager would be a category error. Alertmanager is the fire panel — it lights up the zone. Owner-routing is the dispatcher who looks up whose apartment that is and calls them.
The dispatcher is the triage agent consuming the platform’s identity directory. Two things are worth understanding.
It reads git, not the cluster. The directory is a CQRS read model — a cached projection of the git
Team and Product registries (gitops/teams/, gitops/products/), not live cluster CRs. Ownership is
declared in version control, so resolution is deterministic and reviewable, and it doesn’t depend on the
portal or the cluster being healthy on the incident path.
Resolution and mention-policy are deliberately split into two functions — and that split is a safety property, not tidiness:
resolveOwner({namespace, culpritGithubLogin?}) → {person?, team, on_call, tiers}returns facts: the owning team (the resolution floor — every workload resolves to at least a team), the on-call, and identity links tiered by trust.applyMentionPolicy(resolved, {severity, disposition})walks those facts highest-trust-first and decides who to @mention — the culprit commit author if there’s a real, linkable, in-org human (D12), else falling back to the team.
Why two functions? So a bug in the directory can’t misfire a mention. If resolution and policy were one
blob, a wrong identity link could @ the wrong person on a live incident. Keeping the facts (resolve) apart
from the action (mention) means the risky step — pinging a named human — is a small, auditable helper you can
reason about in isolation: the operator-quality principle that a dangerous control-plane action gets its own
gate.
Honest status. The owner-resolution read model is built and live and has routed real pages. The
paging structure it feeds — per-team PagerDuty — is
provisioned in IaC by the pagerduty
module: one schedule + escalation policy + service per team, escalating (re-notify after 15 min, loop twice).
It uses the v1 pagerduty_schedule resource deliberately — the v3 “flexible schedules” (schedulev2) API
is blocked on a provider bug that returns invalid objects on create. So: real per-team on-call,
seeded rosters, v1 schedules until the provider is fixed. (One transient caveat: the PagerDuty trial
account itself lapsed ~2026-07-07, so these schedules exist in IaC but can’t actually page until it’s
restored — the wiring is intact, the subscription isn’t.)
4. Cost — the speedometer and the odometer
Section titled “4. Cost — the speedometer and the odometer”Cost is just another metric here, and one metaphor explains why there are two exporters: OpenCost is a speedometer; the true-cost exporter is an odometer. You need both, and confusing them is the classic FinOps mistake.
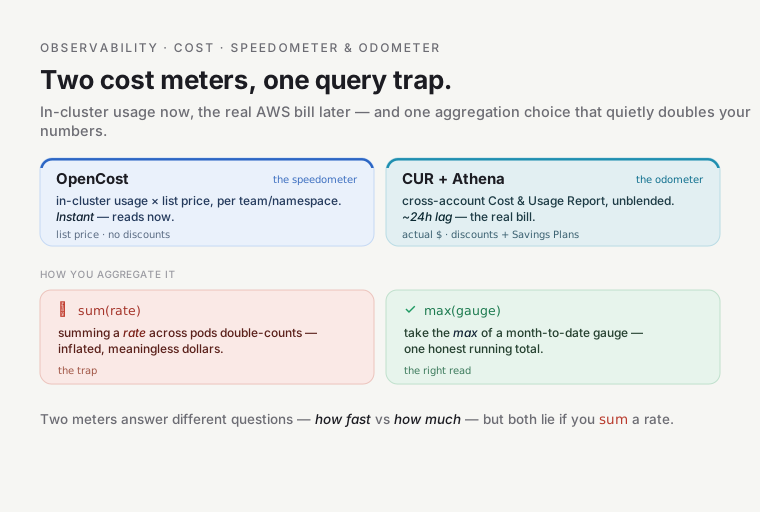
OpenCost — the speedometer (in-cluster allocation). It reads pod/node
resource usage from the cluster and multiplies by AWS list prices (public pricing API, no credentials) to
attribute compute cost per team, derived from the namespace’s platform.refplat.org/team label. It’s
instantaneous and granular — “you’re burning $X/hour right now, and it’s alpha’s doing” — but it’s an
estimate at list price: it knows nothing about your Savings Plans, Reserved Instances, or committed-use
discounts.
The true-cost exporter — the odometer (the real bill). A small Python exporter
(true-cost-exporter.tf)
queries the Cost & Usage Report via Athena — cross-account into the management/payer account via
an AssumeRole onto a read-only cost_reader role — and emits the actual unblended monthly spend
(platform_true_cost_monthly_usd{breakdown, label}) broken down by team, service, and account. This is the
real number, discounts and all, but it lags ~24h (CUR latency), so it refreshes every 6 hours, not per
scrape. Both live on the hub:
$ kubectl -n observability get pods | grep -E 'opencost|true-cost'opencost-… 2/2 Runningtrue-cost-exporter-… 1/1 RunningThe
max-not-sumgotcha. The exporter re-emits an absolute month-to-date gauge on every scrape. So a dashboard panel that doessum()over time — the reflexive choice for a cost panel — double-counts: you’re summing the same running total across scrapes. The true-cost panels aggregate withmaxinstead (the latest month-to-date value is the month’s total so far). Speedometer numbers you integrate; odometer numbers you read.
The budget enforcer — cost that can say “no”
Section titled “The budget enforcer — cost that can say “no””The last mile turns cost from a dashboard into a guardrail
(budget-enforcer.tf):
- an hourly CronJob queries Mimir for each team’s spend ÷ budget;
- it writes the over-budget teams into a
cost-budget-statusConfigMap; - a Kyverno policy (
restrict-over-budget-provisioning) reads that ConfigMap and blocks a newXEnvironmentfrom being provisioned by an over-budget team.
Two design choices make this safe: audit-first (it reports before it enforces) and fail-open — a
missing or blank ConfigMap is treated as “everyone’s fine”, so an observability outage can never block
provisioning (failurePolicy: Ignore), and there’s an admin override annotation
(cost.refplat.org/budget-override). It gates new provisioning only — it never touches running workloads.
Honest status. The cost guardrails — surface, alerting, and the enforcement bridge — are built and live (2026-06-30). But the enforcer is opt-in and off by default (
enable_budget_enforcer = false), designed to run on the preprod spoke (where OpenCost + the team budgets sit) — so on theplatformhub there is no enforcer CronJob and nocost-budget-statusConfigMap. The surface + alerting run on the hub; the enforcement bridge is fully built and wired end-to-end in code but is a spoke concern, not a hub one.
Synthetic signals — pre-empting the page
Section titled “Synthetic signals — pre-empting the page”Three smaller machines generate signals before a real user hits the failure, all live on the hub:
- blackbox-exporter — an outside-in probe: it hits your public HTTPS endpoints through the Cilium Gateway and checks they answer with a valid cert. “Is it up from the outside?”
- k6 — a scheduled multi-step journey (a CronJob remote-writing metrics to Mimir): not just “is it 200?” but “can a user complete the flow?”
- policy-reporter — turns Kyverno
PolicyReports intopolicy_report_resultmetrics, so admission violations become dashboardable and alertable (thepolicy-reporter.rulesgroup).
Outside-in probes and journeys page you before the SLO burns; policy-reporter makes governance itself an observable signal.
Gotchas
Section titled “Gotchas”- Two SLO paths, two tenants. The apiserver SLO is a Sloth
PrometheusServiceLevelevaluated on the hub; per-app SLOs are templated rules run in the Mimir ruler against thepreprodtenant. If you go looking for a per-app burn-rate rule as aPrometheusRuleon the hub, you won’t find it — it’s a ruler rule on the spoke tenant. Same math, different home. continue = trueis the whole triage design. The agent is fanned a copy of critical alerts; the original still pages humans. Flip it tofalseand the agent silently becomes a black hole for every page.- Warnings don’t page. Only
criticalreaches PagerDuty (a severity-based design fact — though the PagerDuty leg is dormant while the trial account is lapsed, see §2). That’s why the 6-day-outage fix was a severity upgrade, not a new alert — the alerts existed, they just didn’t page. - The dead-man’s switch is inverted logic.
Watchdogfiring is healthy; the alert is its silence. Don’t “fix” Watchdog by silencing it — you’d be disabling the only thing that catches a dead pipeline. max, notsum, for true-cost panels. The odometer re-emits a running total; summing it double-counts. This one shipped as a real bug fix.- Fail-open is a feature, not a bug. The budget enforcer and its Kyverno policy both default to allow on any doubt. A cost guardrail that blocked provisioning during an observability outage would be worse than the overspend it prevents.
resolveOwner≠applyMentionPolicy. Resolution returns facts; policy decides who gets @-mentioned. The split exists so a directory bug can’t ping the wrong human on a live incident.
Go deeper
Section titled “Go deeper”- ADRs: ADR-056 progressive delivery · ADR-084 identity directory & owner-resolution · ADR-091 cost guardrails.
- The code:
observability-slo/(Sloth) ·observability-mimirapp-SLO template ·observability/alerts/curated.yaml·observability-opencost/·pagerduty/. - External: Google SRE Workbook — Alerting on SLOs (the multi-window multi-burn-rate source) · Sloth · OpenCost docs · Prometheus Alertmanager configuration.
- Back to the observability orientation · the terse reference.